User Manual
IPOP is a multi-omics, multi-plant database, in which dataset contains Histone Modification, Chromatin Accessibility, Chromatin Interaction, Population Genomics, DNA 5mC Modification, Transcriptome, RNA m6A Modification data, and the results of Evolutionary Genomics studies; involves 13 species. IPOP provides multiple omics results data search and download functions, and six tools for users to analyze multiple omics data.
1 Browser
The Browser bar on homepage Provides the ability to view genomic annotations, as well as different omics data for each species.
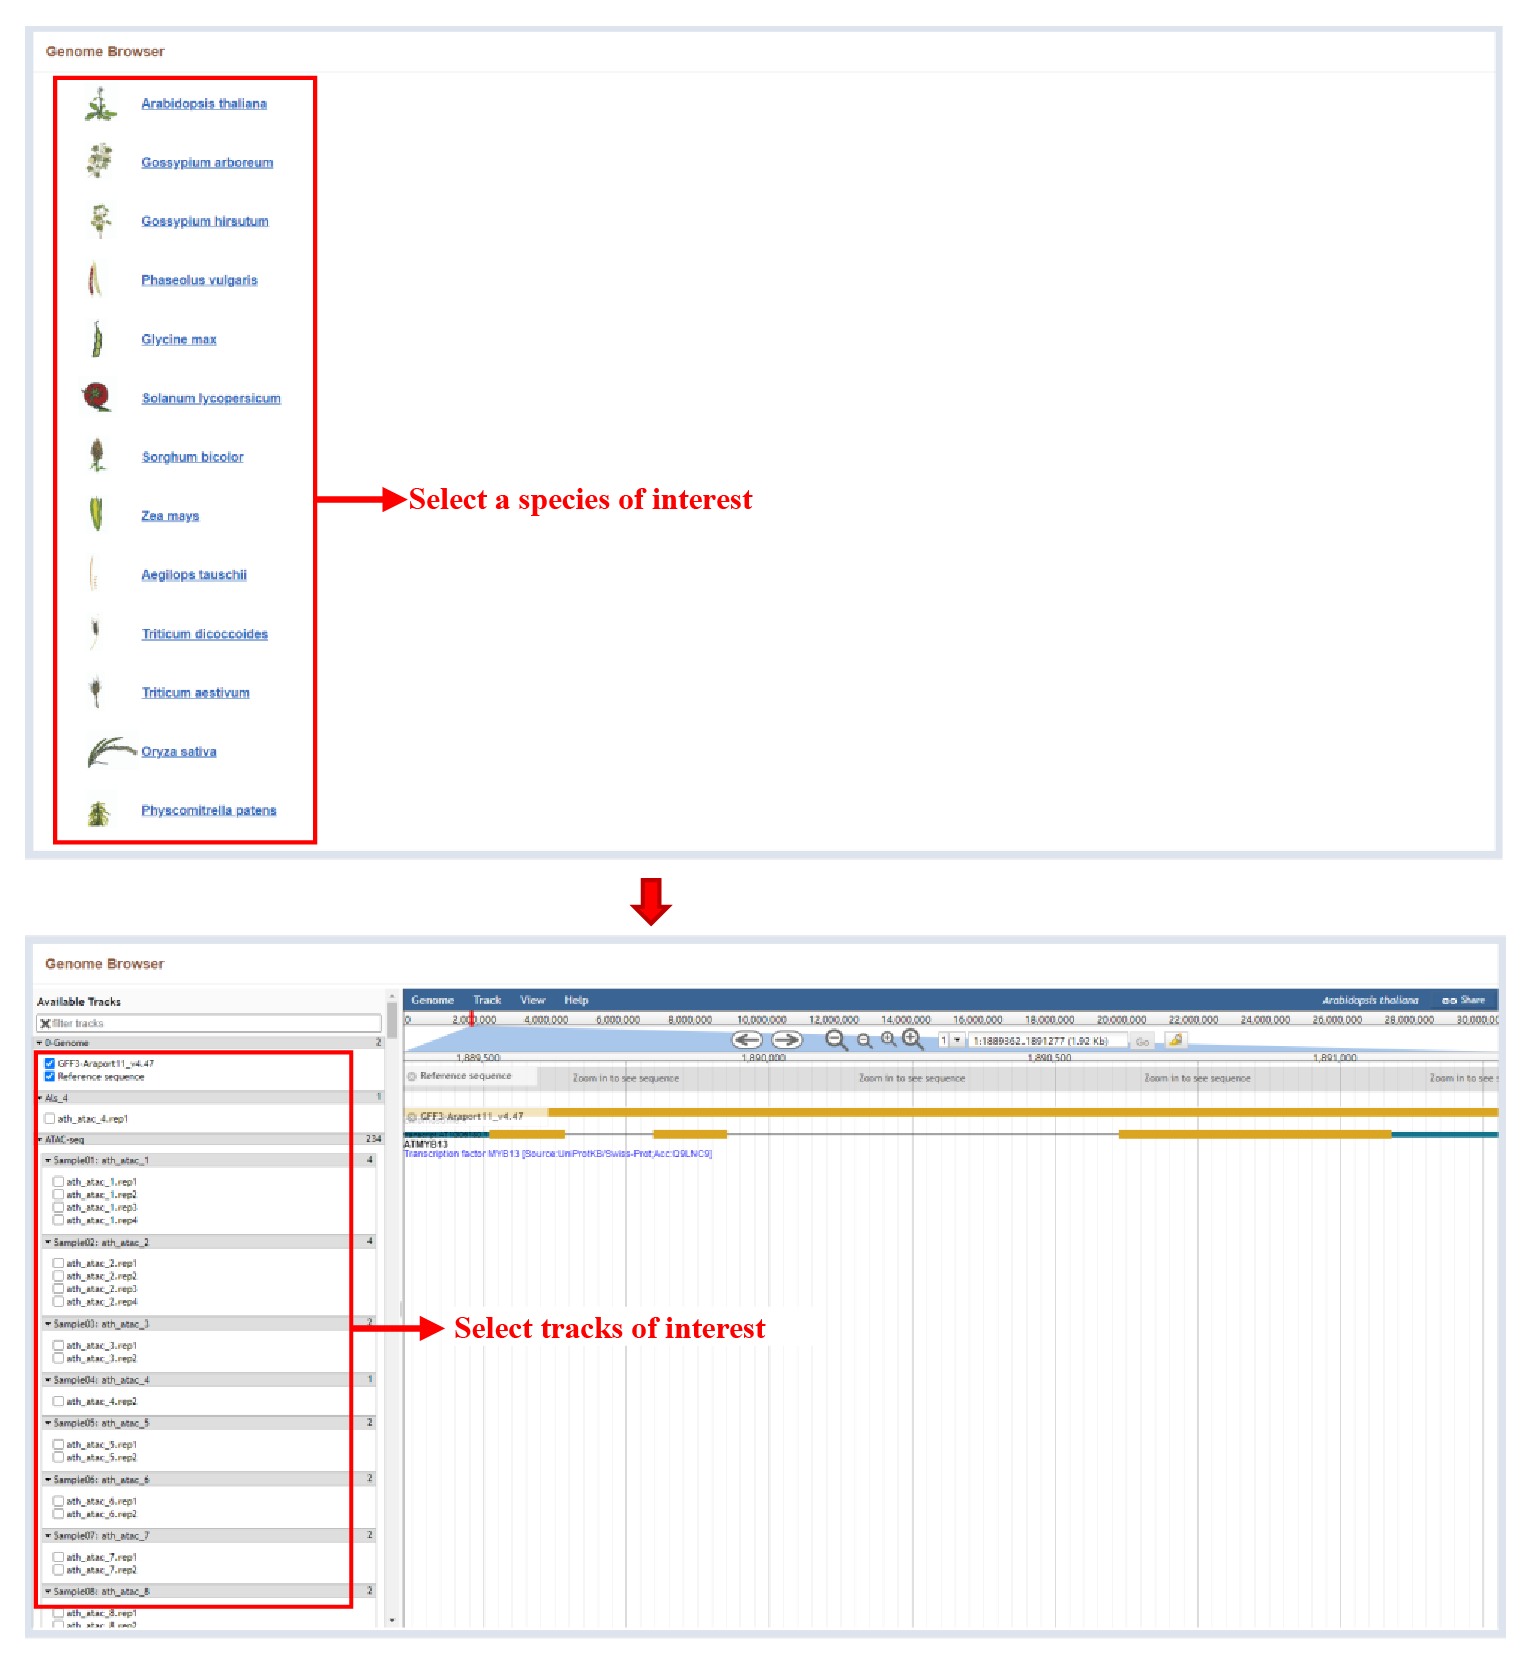
Figure 1 Browser module
Select the species on the browser page to enter the Jbrowse to view all the omics sequence information of the species.
2 Search
The Search bar on the home page provides the ability to search by gene IDs, key words and sample IDs.
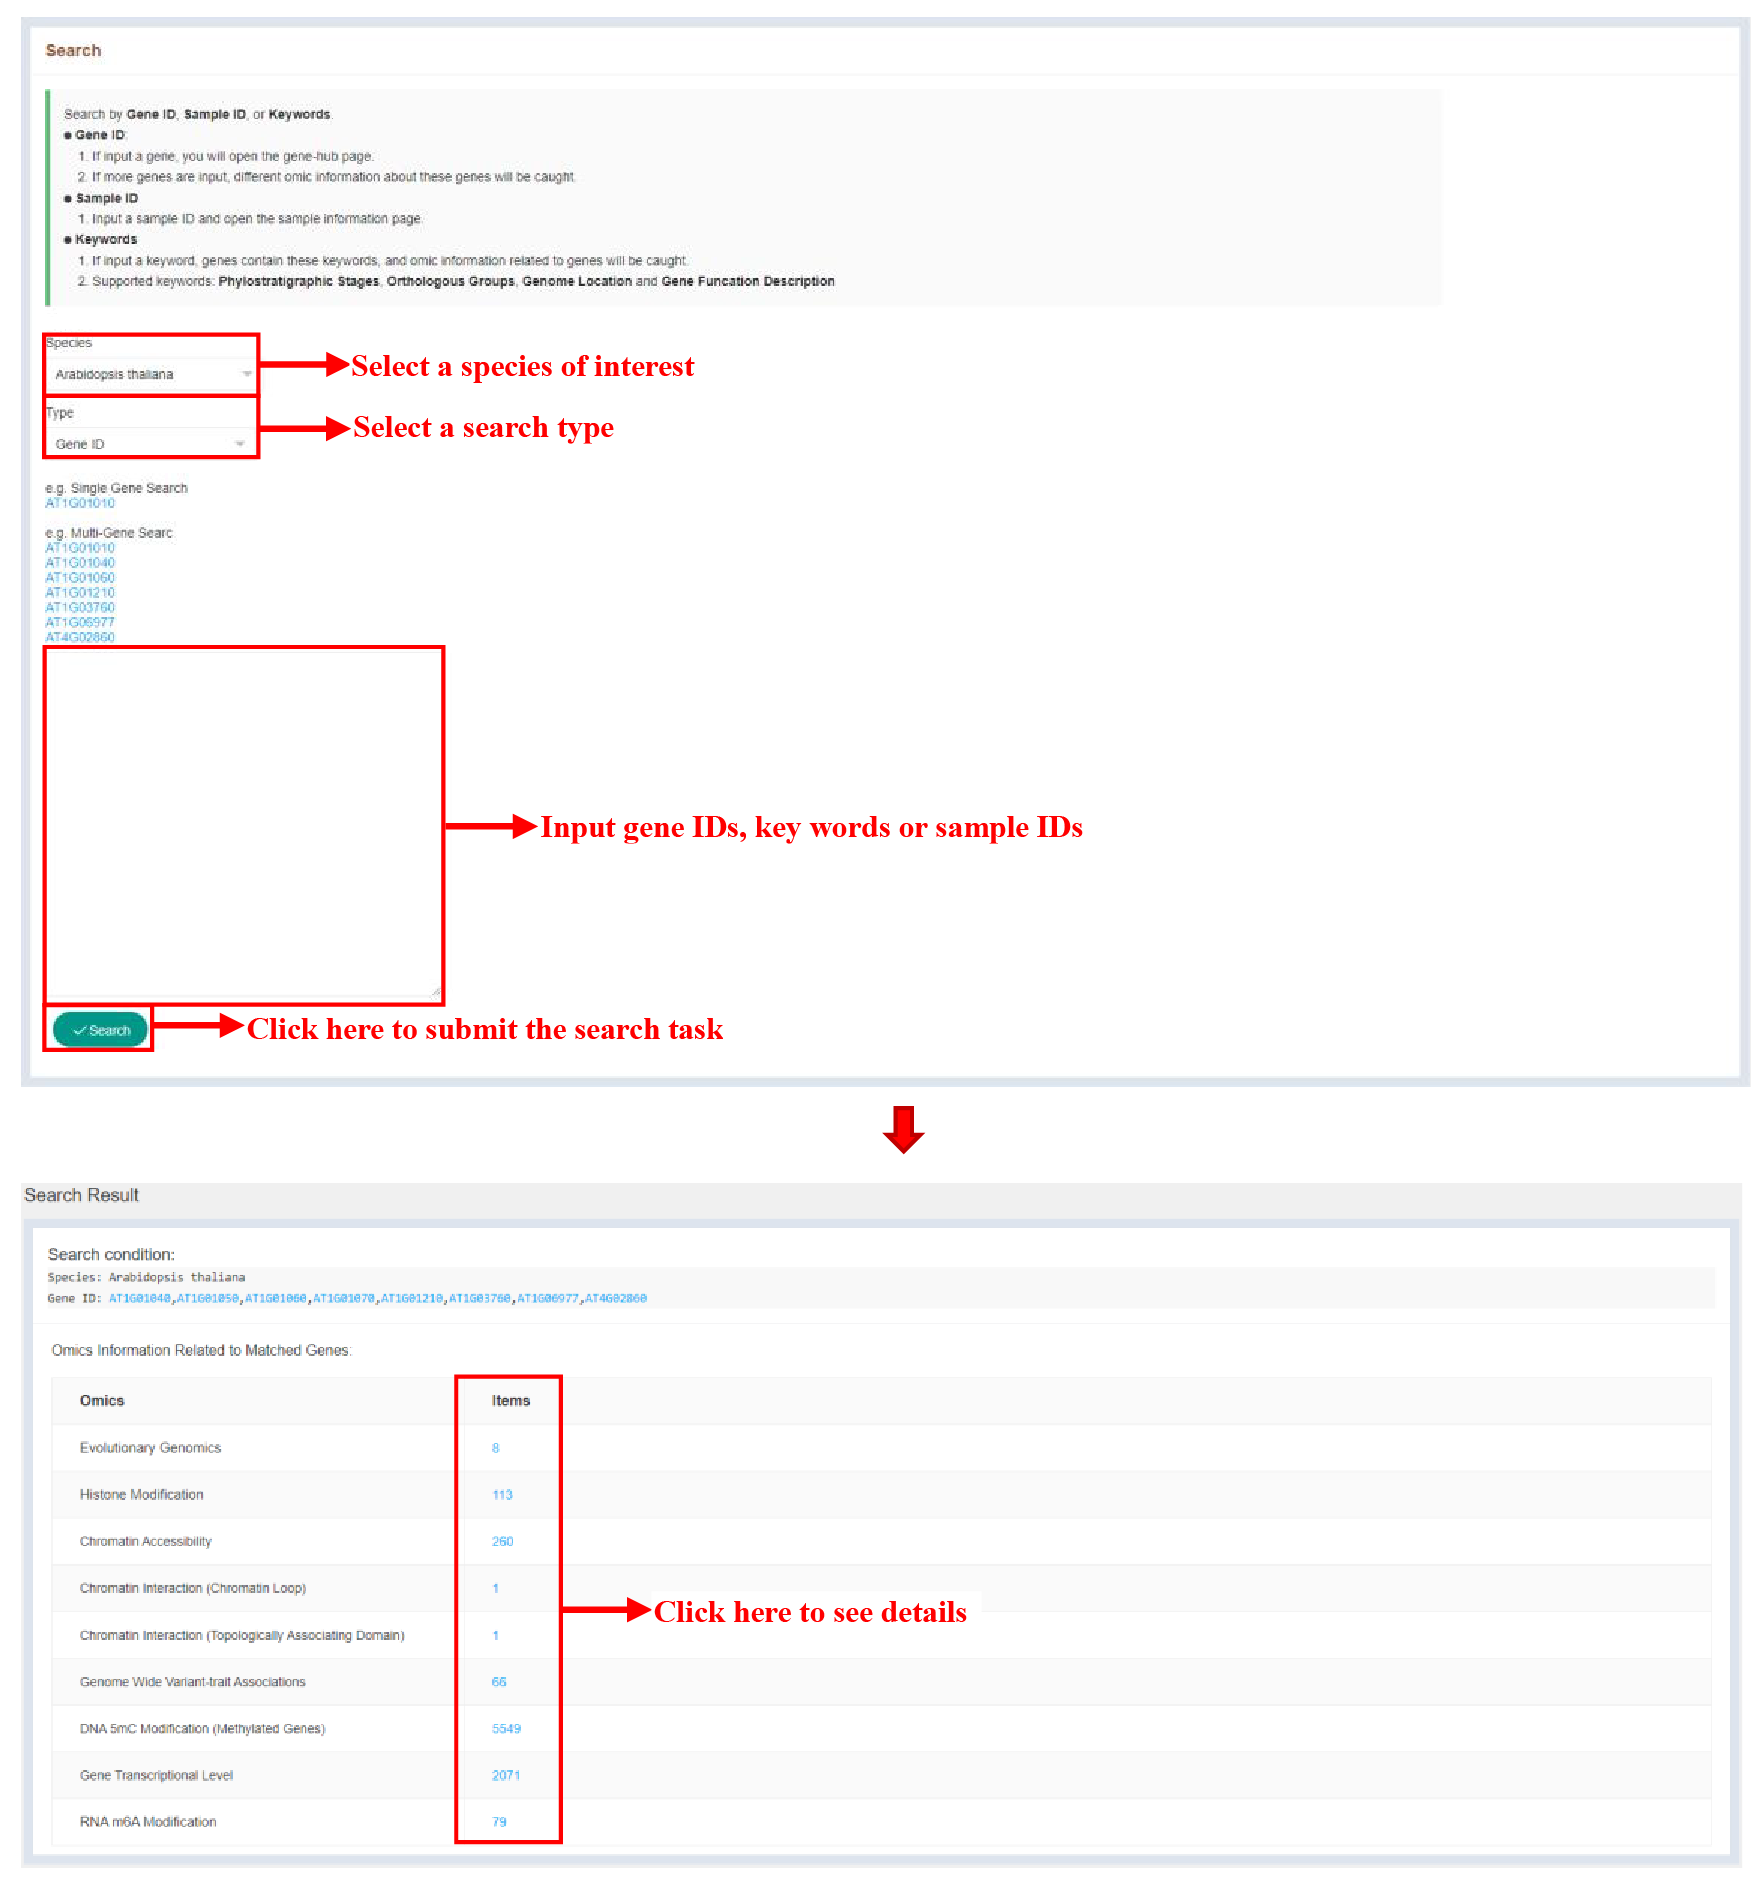
Figure 2 Search module
The figure above shows the result page of the search function, and the number of terms related to the search content is displayed at items.
3 Evolutionary Genomics
3.1 Index page
The Evolutionary Genomics bar provides evolutionary information of all genes in IPOP.
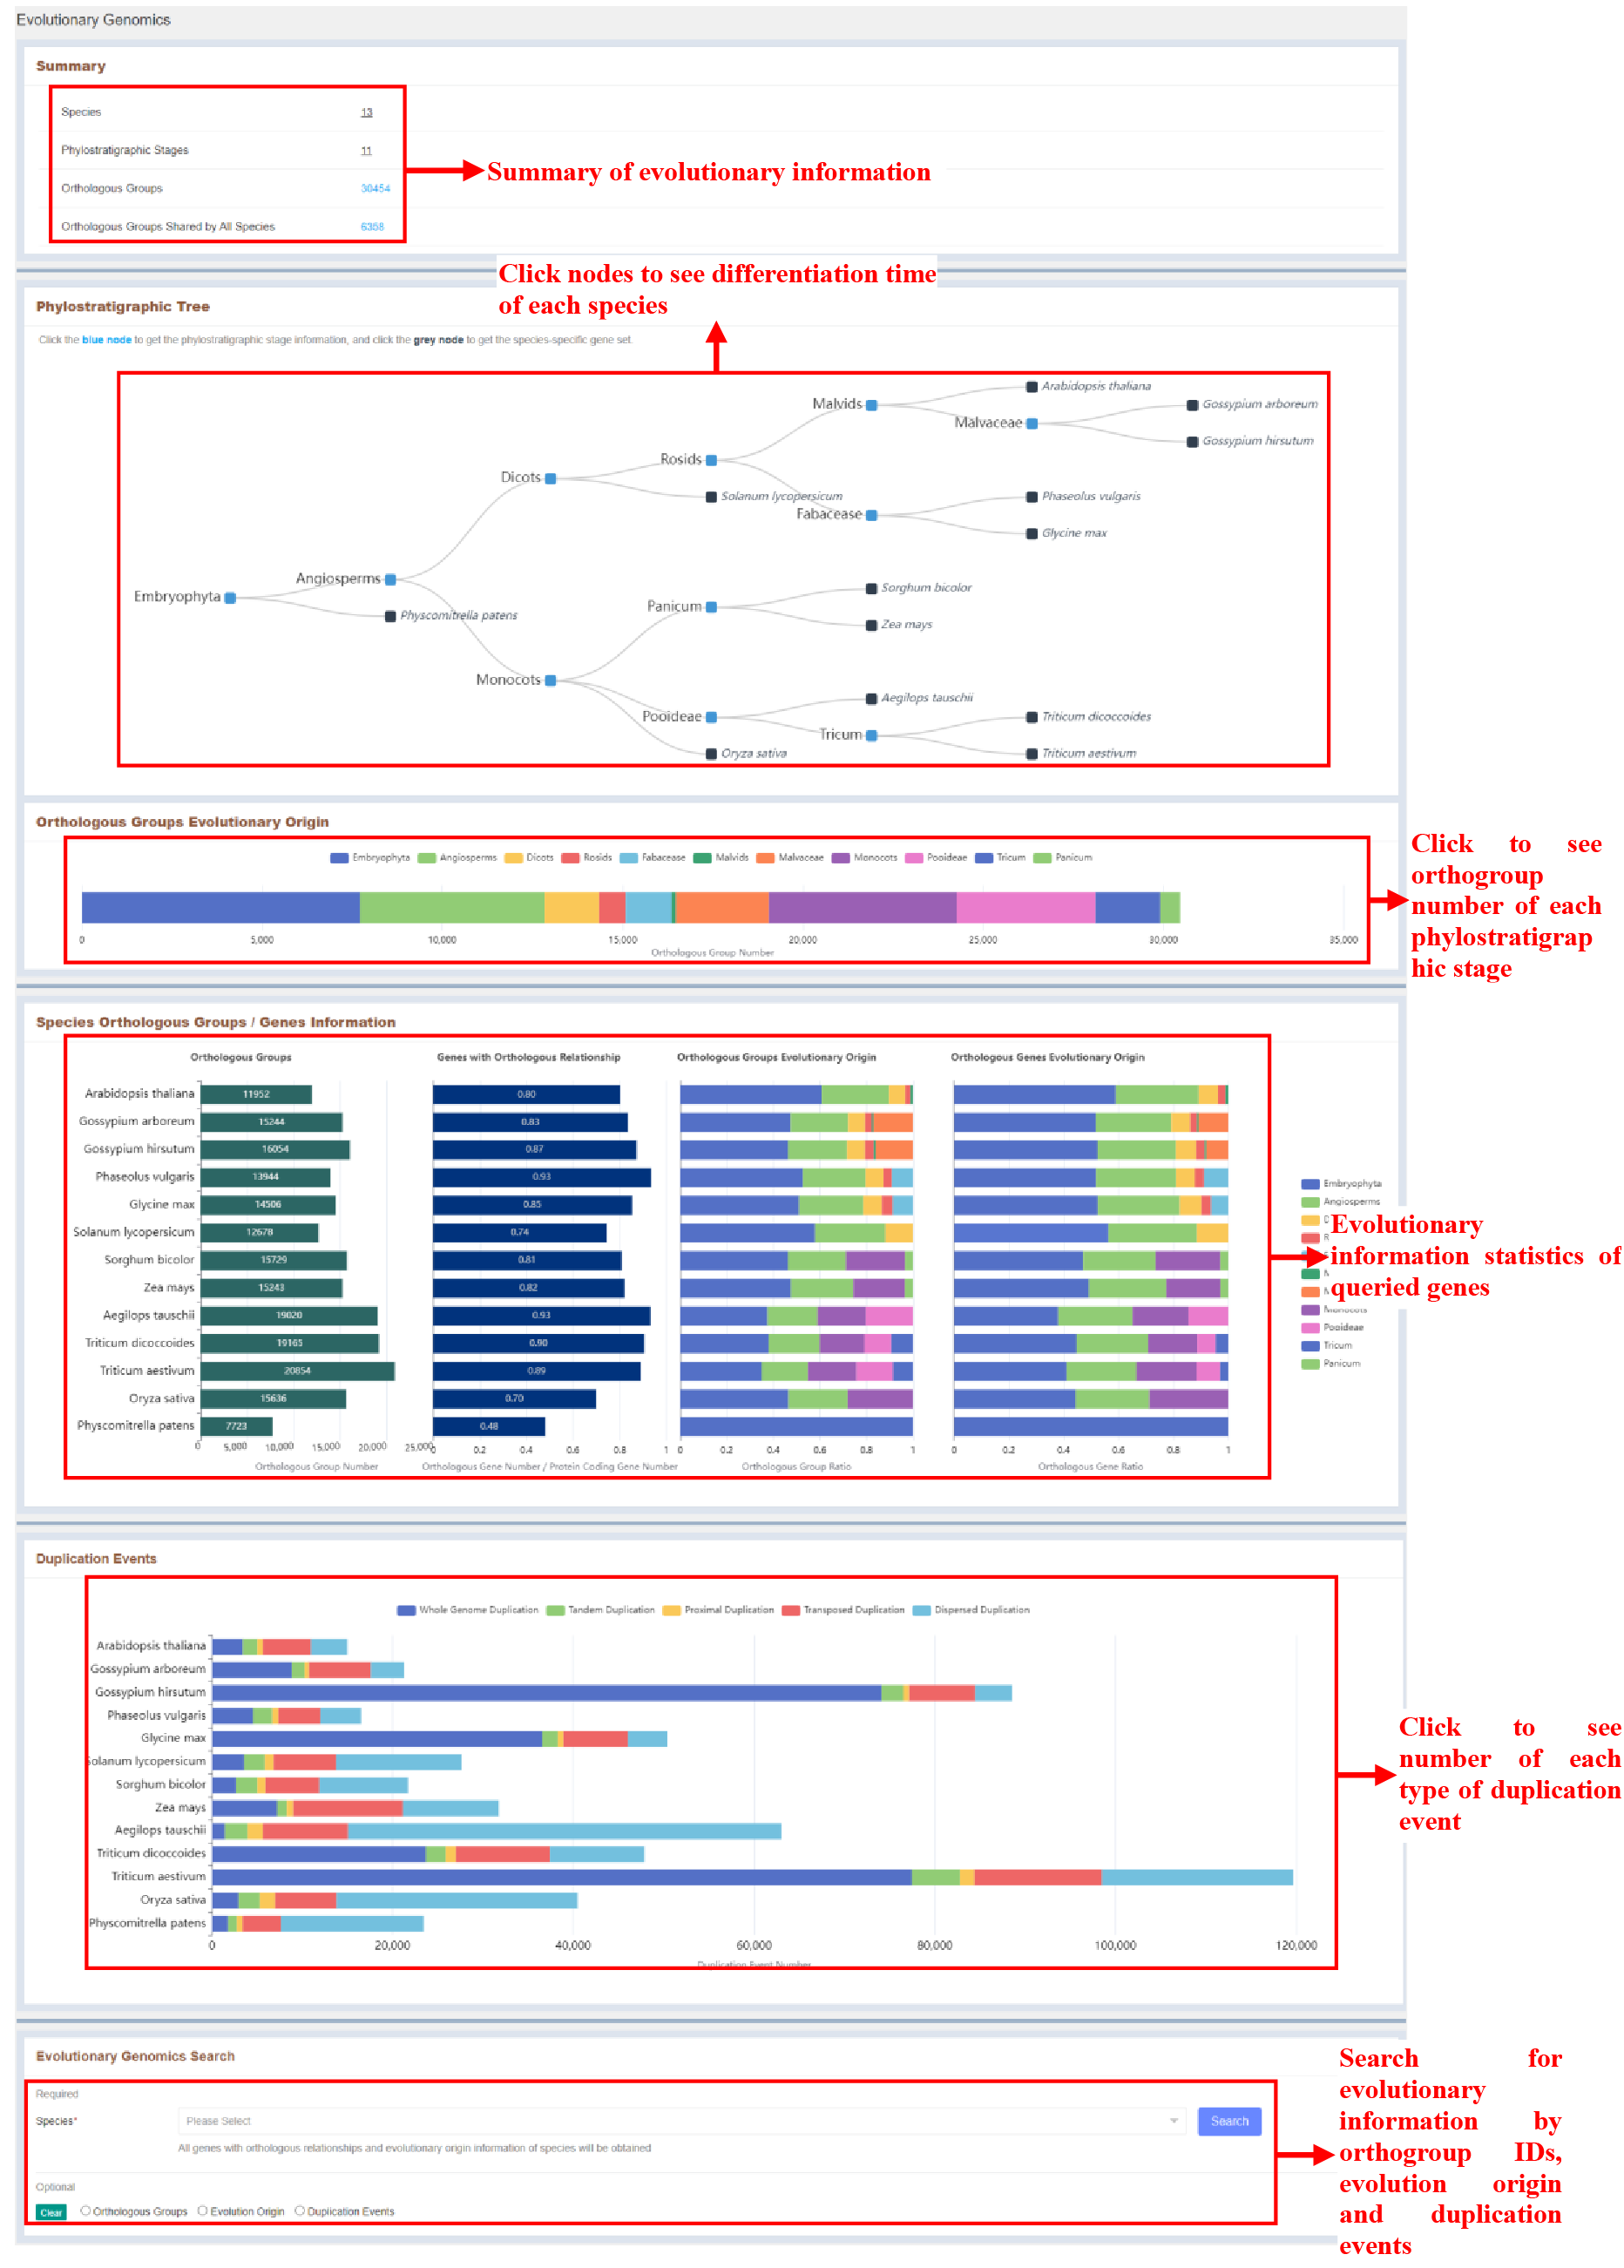
Figure 3 Evolutionary genomics module
3.2 Phylostratigraphic Stage
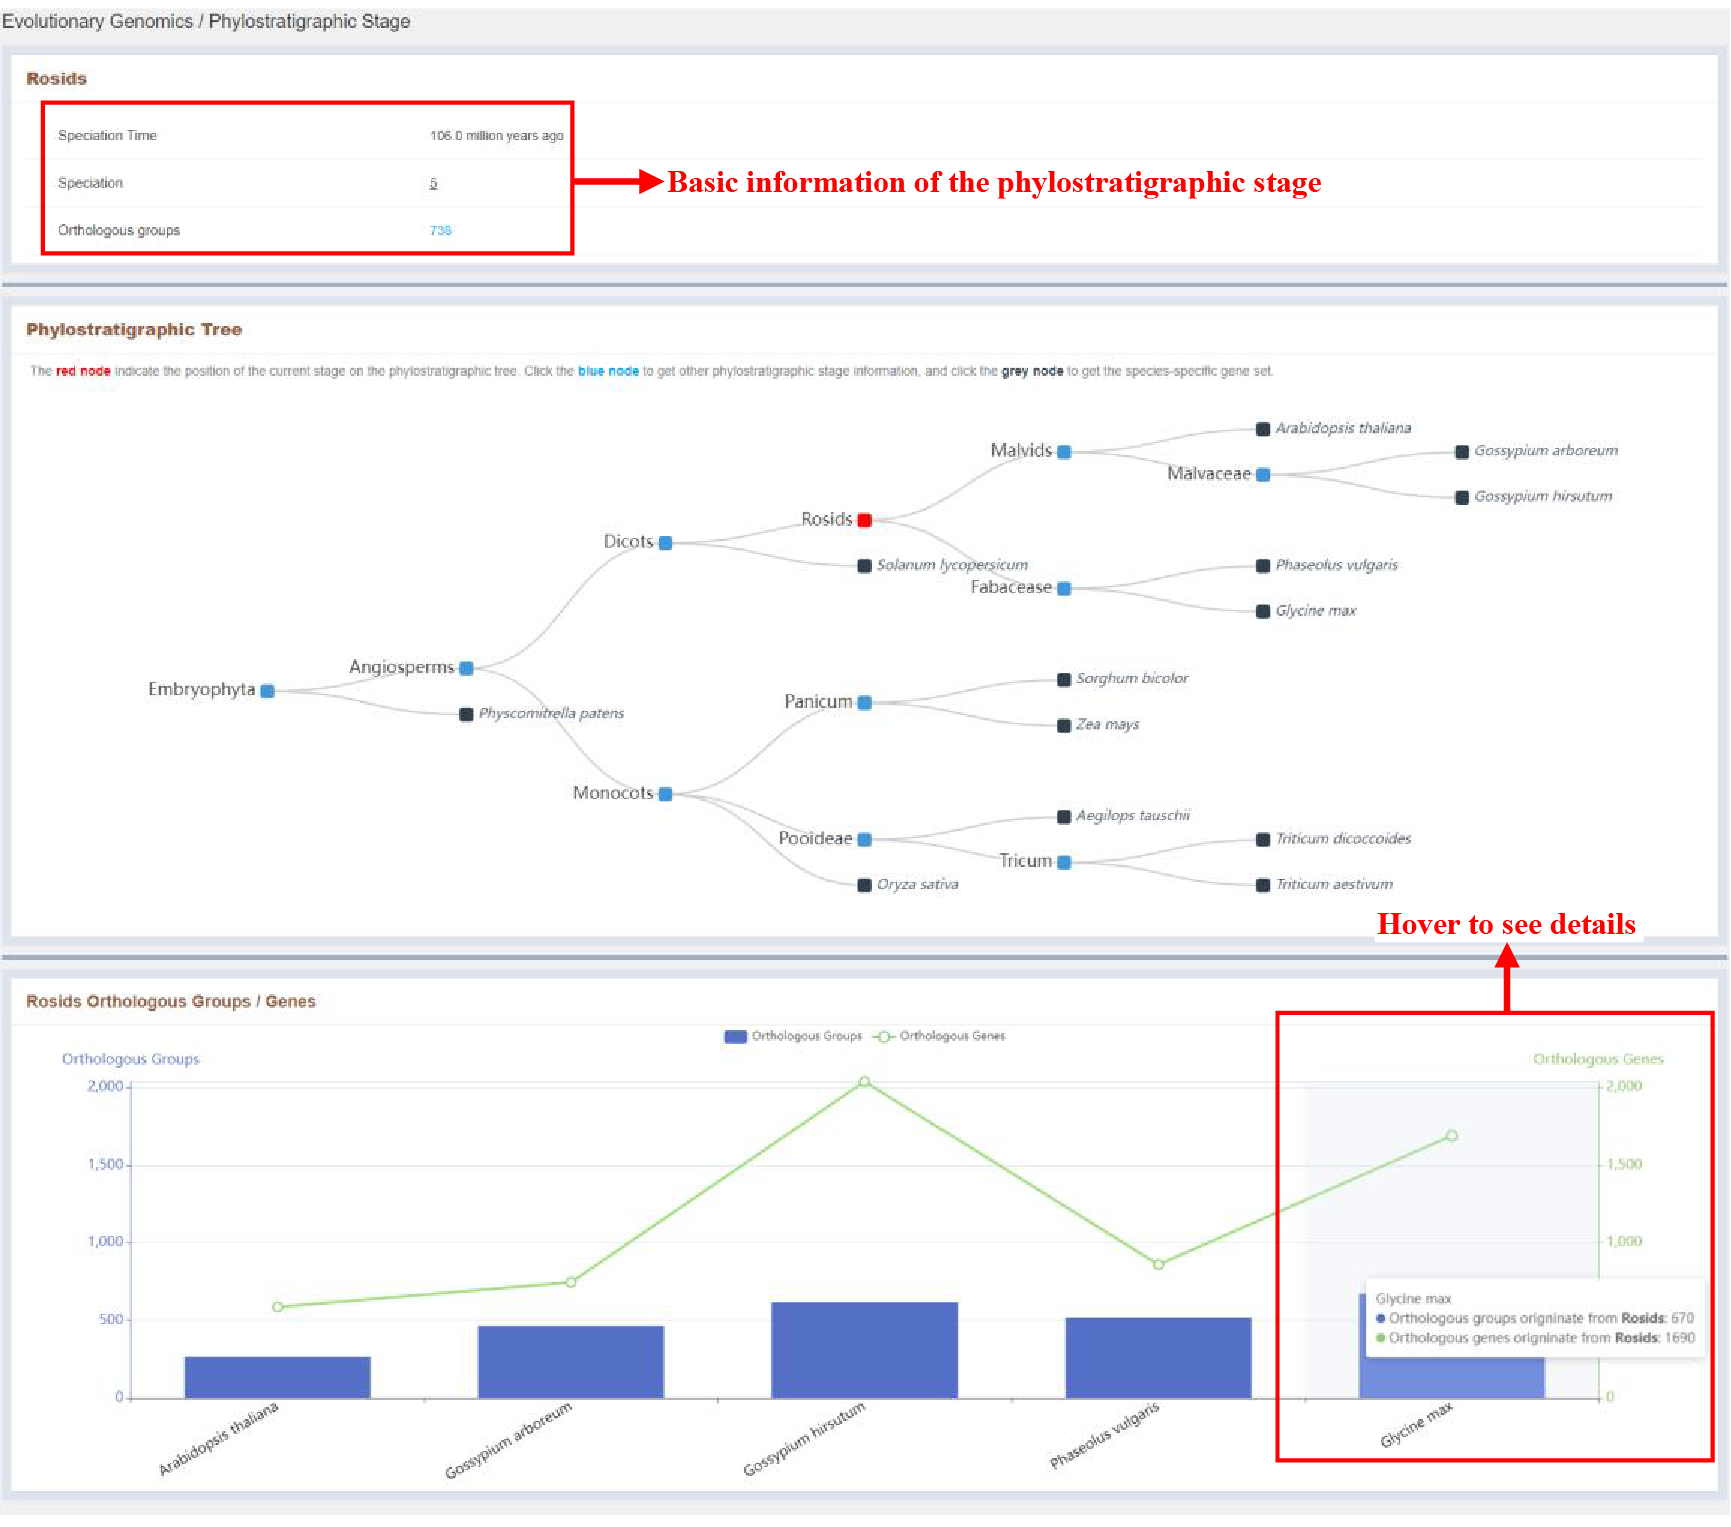
Figure 4 Phylostratigraphic Stage page
Click nodes in the phylostratigraphic tree on the index page jump to Phylostratigraphic Stage page. Phylostratigraphic Stage page provides detailed information and statistics of the phylostratigraphic stage.
3.3 Orthologous Groups
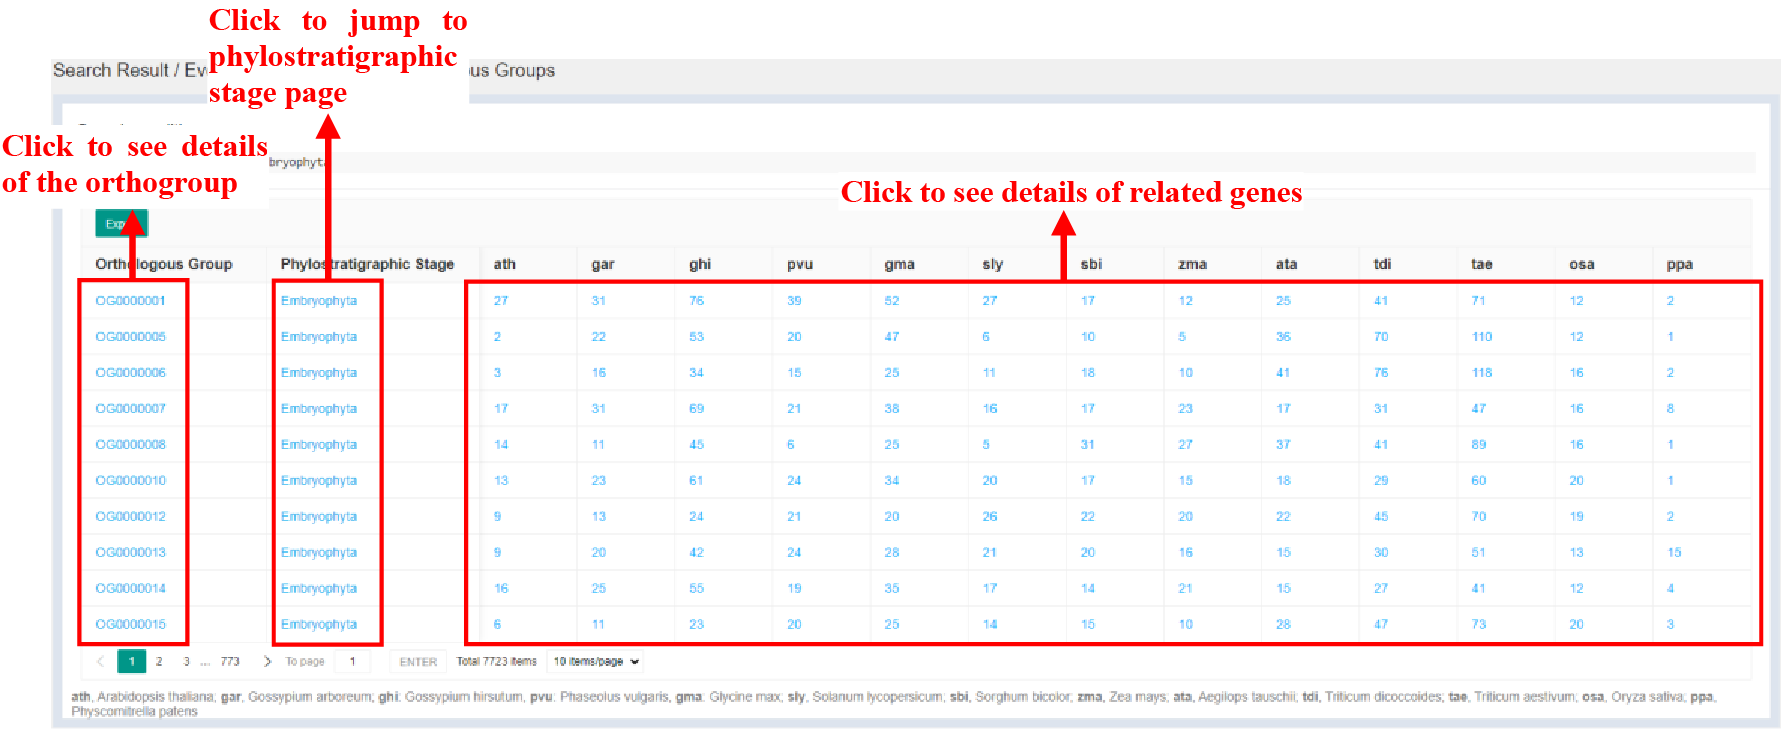
Figure 5 Orthologous Groups page
Click bars of the Orthologous Groups Evolutionary Origin part and Species Orthologous Groups / Genes Information part in Evolutionary Genomics page to jump to Orthologous Group page. Orthologous Group page provides statistics of genes related to the orthogroup.
3.4 Duplication Event
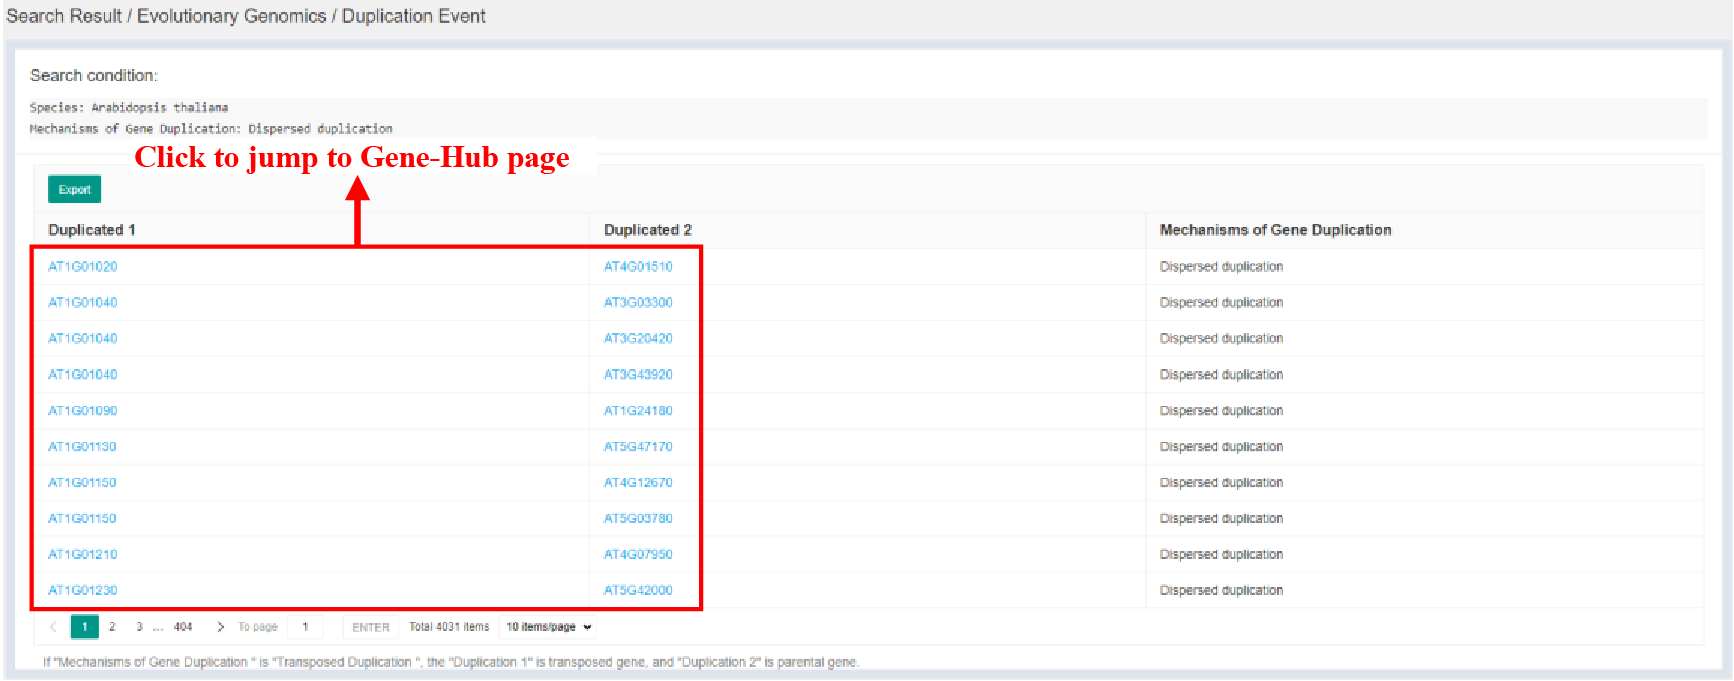
Figure 6 Duplication Event page
Click bars of Duplication Events part in Evolutionary Genomics page to jump to Duplication Event page. Duplication Event page provides detailed duplication events and mechanisms of which.
3.5 Search Result page
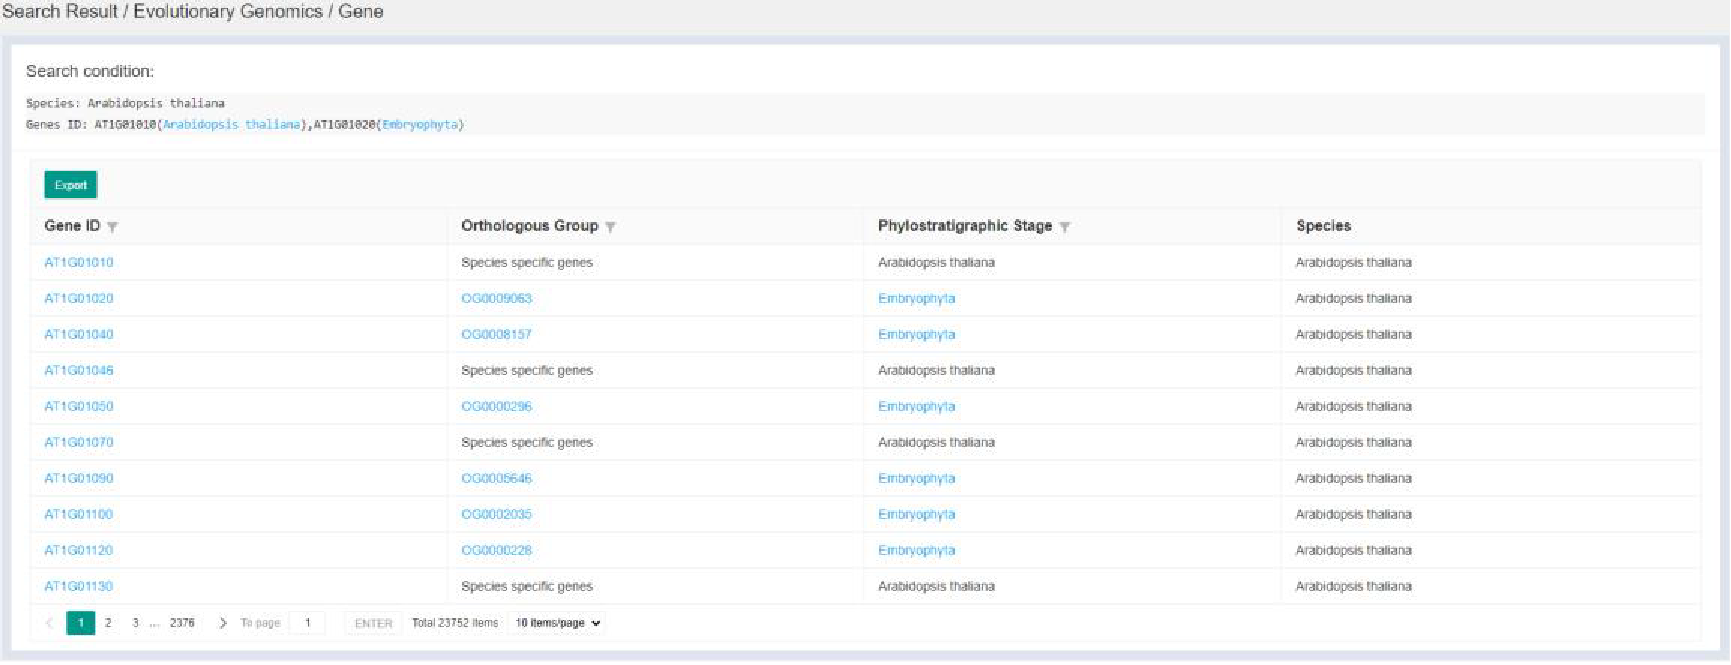
Figure 7 Gene page
Search by Orthologous groups and Evolution Origin jump to Gene page. Gene page provides detailed evolutionary information of related genes. Search by Duplication Events jump to Duplication Events page, which was introduced in 3.4.
4 Omics-Hub Portal
4.1 Histone Modification
4.1.1 Sample Statistics Page
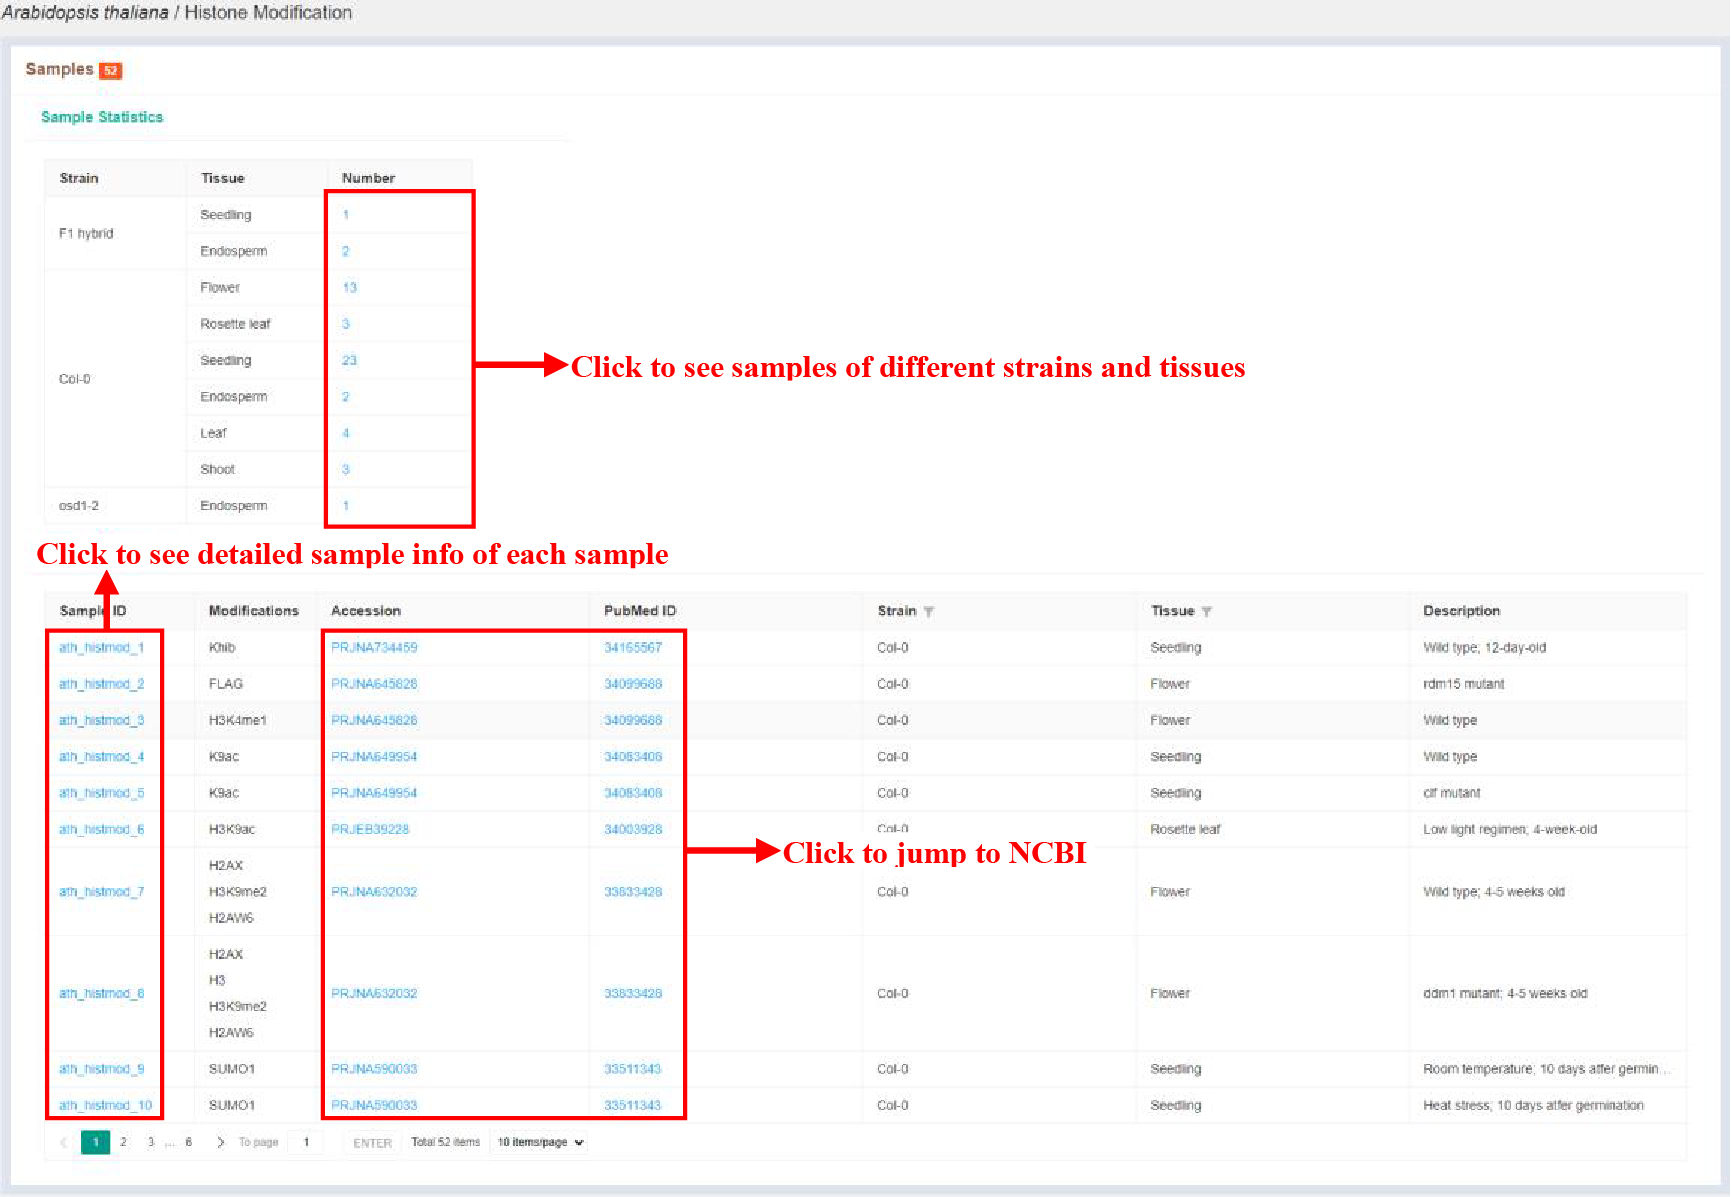
Figure 8 Sample statistics of histone modification
The Sample statistics page shows the sample statistics of different strains and tissues, and lists the basic information of each sample.
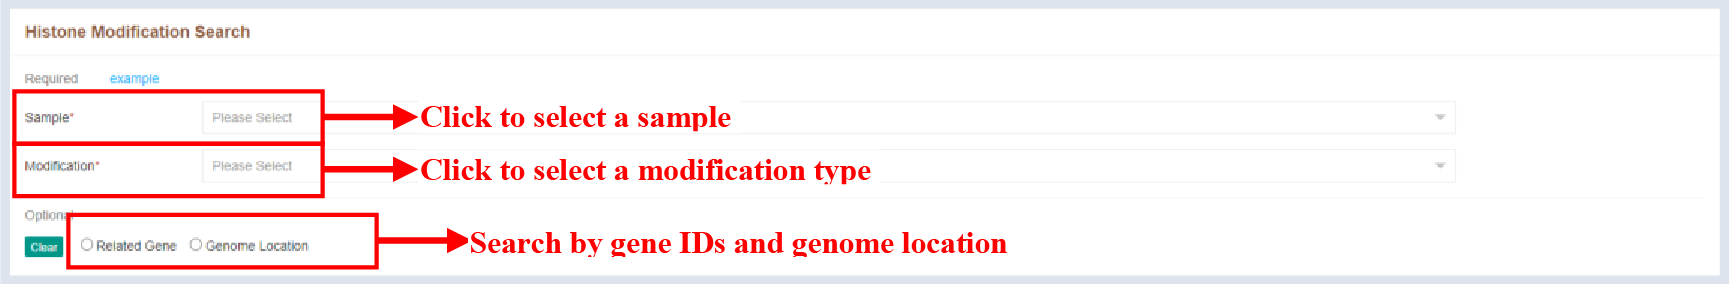
Figure 9 Search module of histone modification
Search module of histone modification provides the ability to search for histone modification peaks using gene IDs and genome location.
4.1.2 Sample Infomation Page
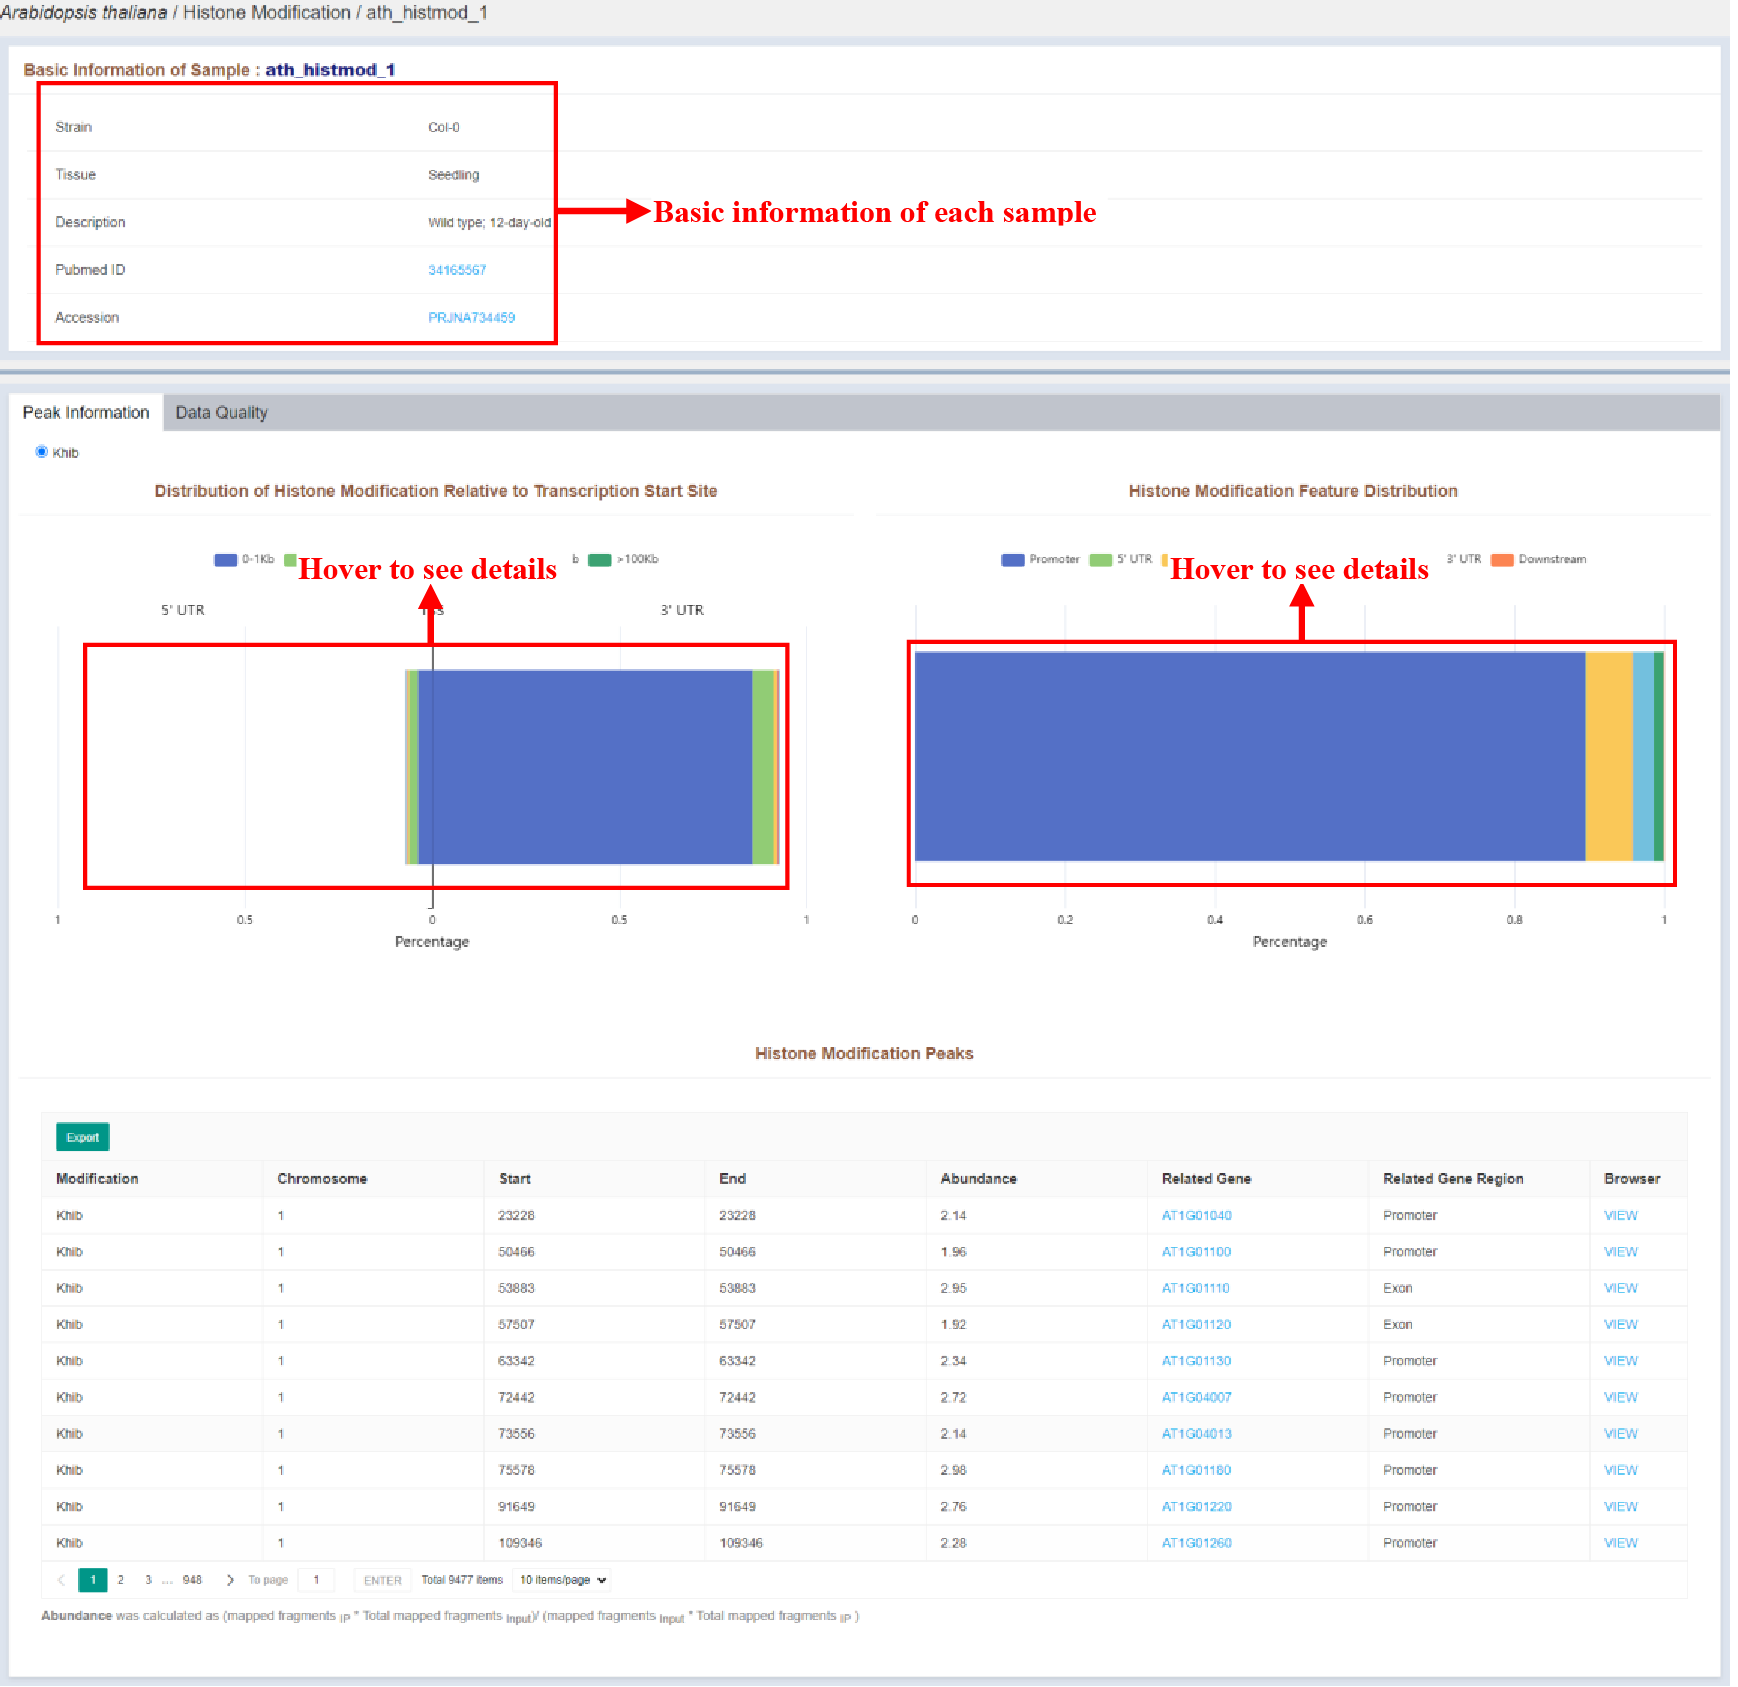
Figure 10 Sample infomation page of histone modification
Sample infomation displays the basic information of the sample and the statistics of the distribution of peaks identified in the sample. The details of each peak are listed in the Histone Modification Peaks table, which is as follows:
| Columns | Details |
|---|---|
| Modificaion | Modification type of the peak |
| Chromosome | Chromosome of the peak |
| Start | Start position of the peak |
| End | End position of the peak |
| Abundance | Abundance of the peak |
| Related Gene | Related gene of the peak |
| Related Gene Region | Related gene region of the peak |
4.2 Chromatin Accessibility
4.2.1 Sample Statistics Page
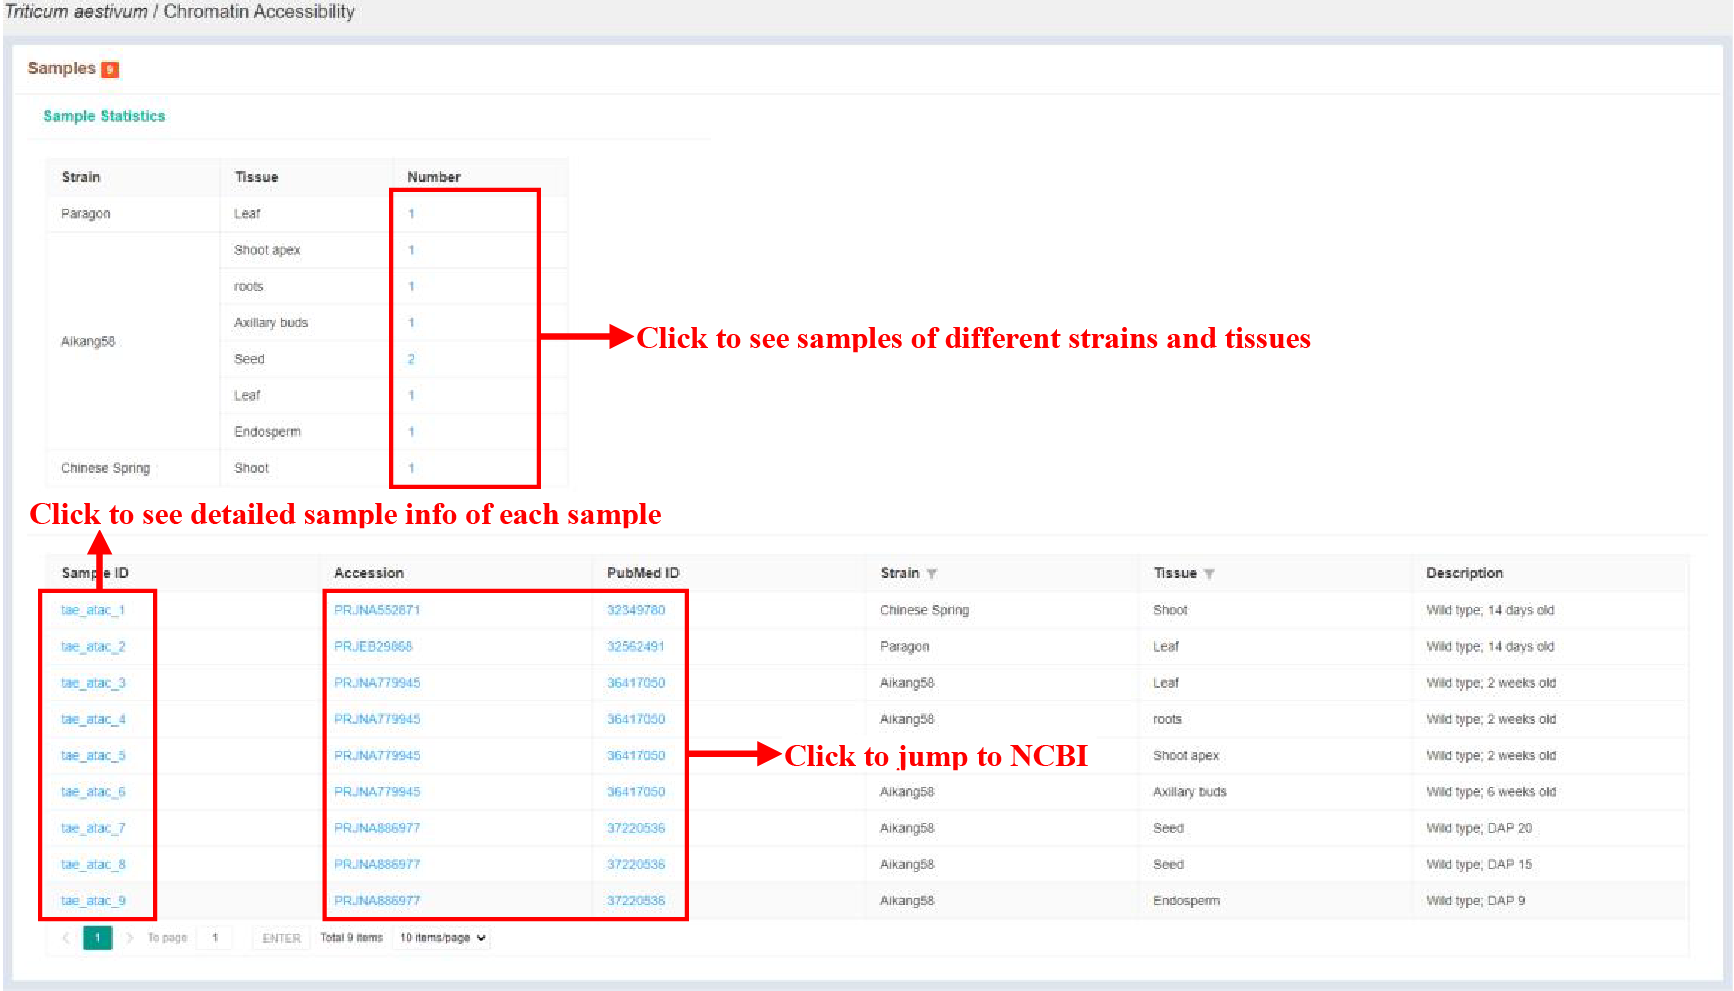
Figure 11 Sample statistics of chromatin accessibility
The Sample statistics page shows the sample statistics of different strains and tissues, and lists the basic information of each sample.
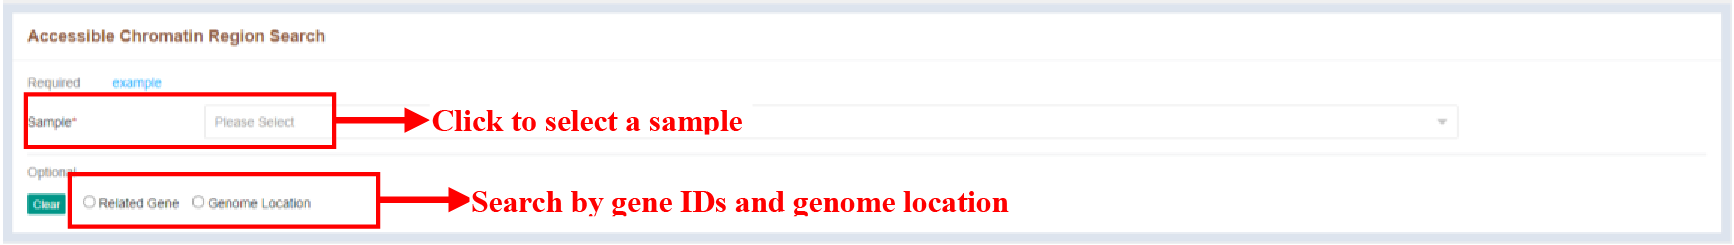
Figure 12 Search module of chromatin accessibility
Search module of chromatin accessibility provides the ability to search for chromatin accessibility regions using gene IDs and genome location.
4.2.2 Sample Infomation Page
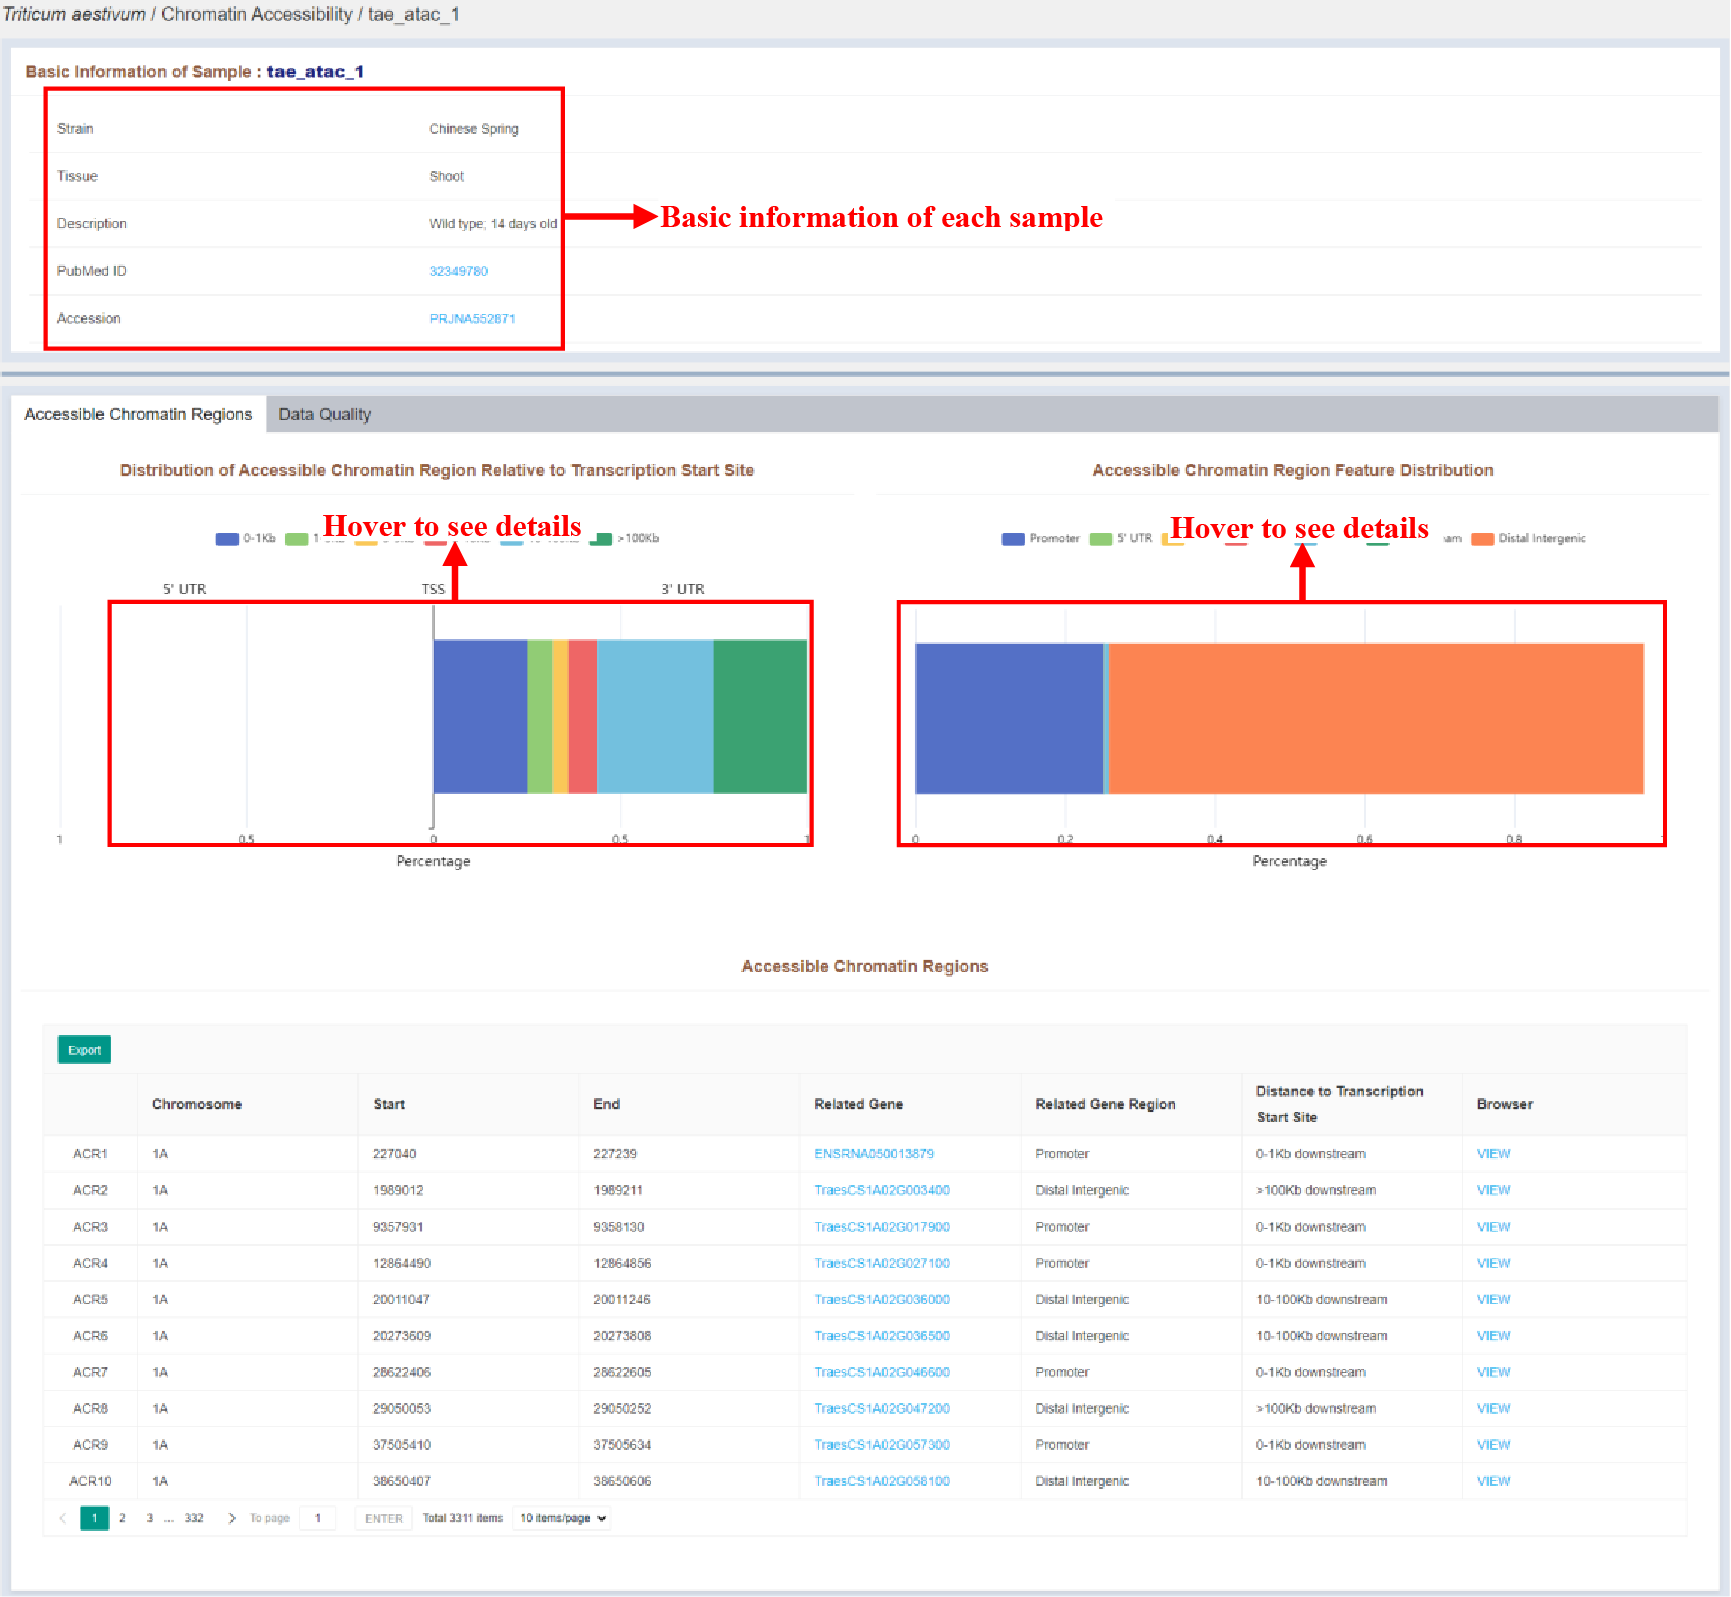
Figure 13 Sample infomation page of chromatin accessibility
Sample infomation displays the basic information of the sample and the statistics of the distribution of peaks identified in the sample. The details of each peak are listed in the Accessible Chromatin Regions table, which is as follows:
| Columns | Details |
|---|---|
| Chromosome | Chromosome of the accessible region |
| Start | Start position of the accessible region |
| End | End position of the accessible region |
| Abundance | Abundance of the accessible region |
| Related Gene | Related gene of the accessible region |
| Related Gene Region | Related gene region of the accessible region |
| Distance to Transcription Start Site | Distance to Transcription Start Site of the accessible region |
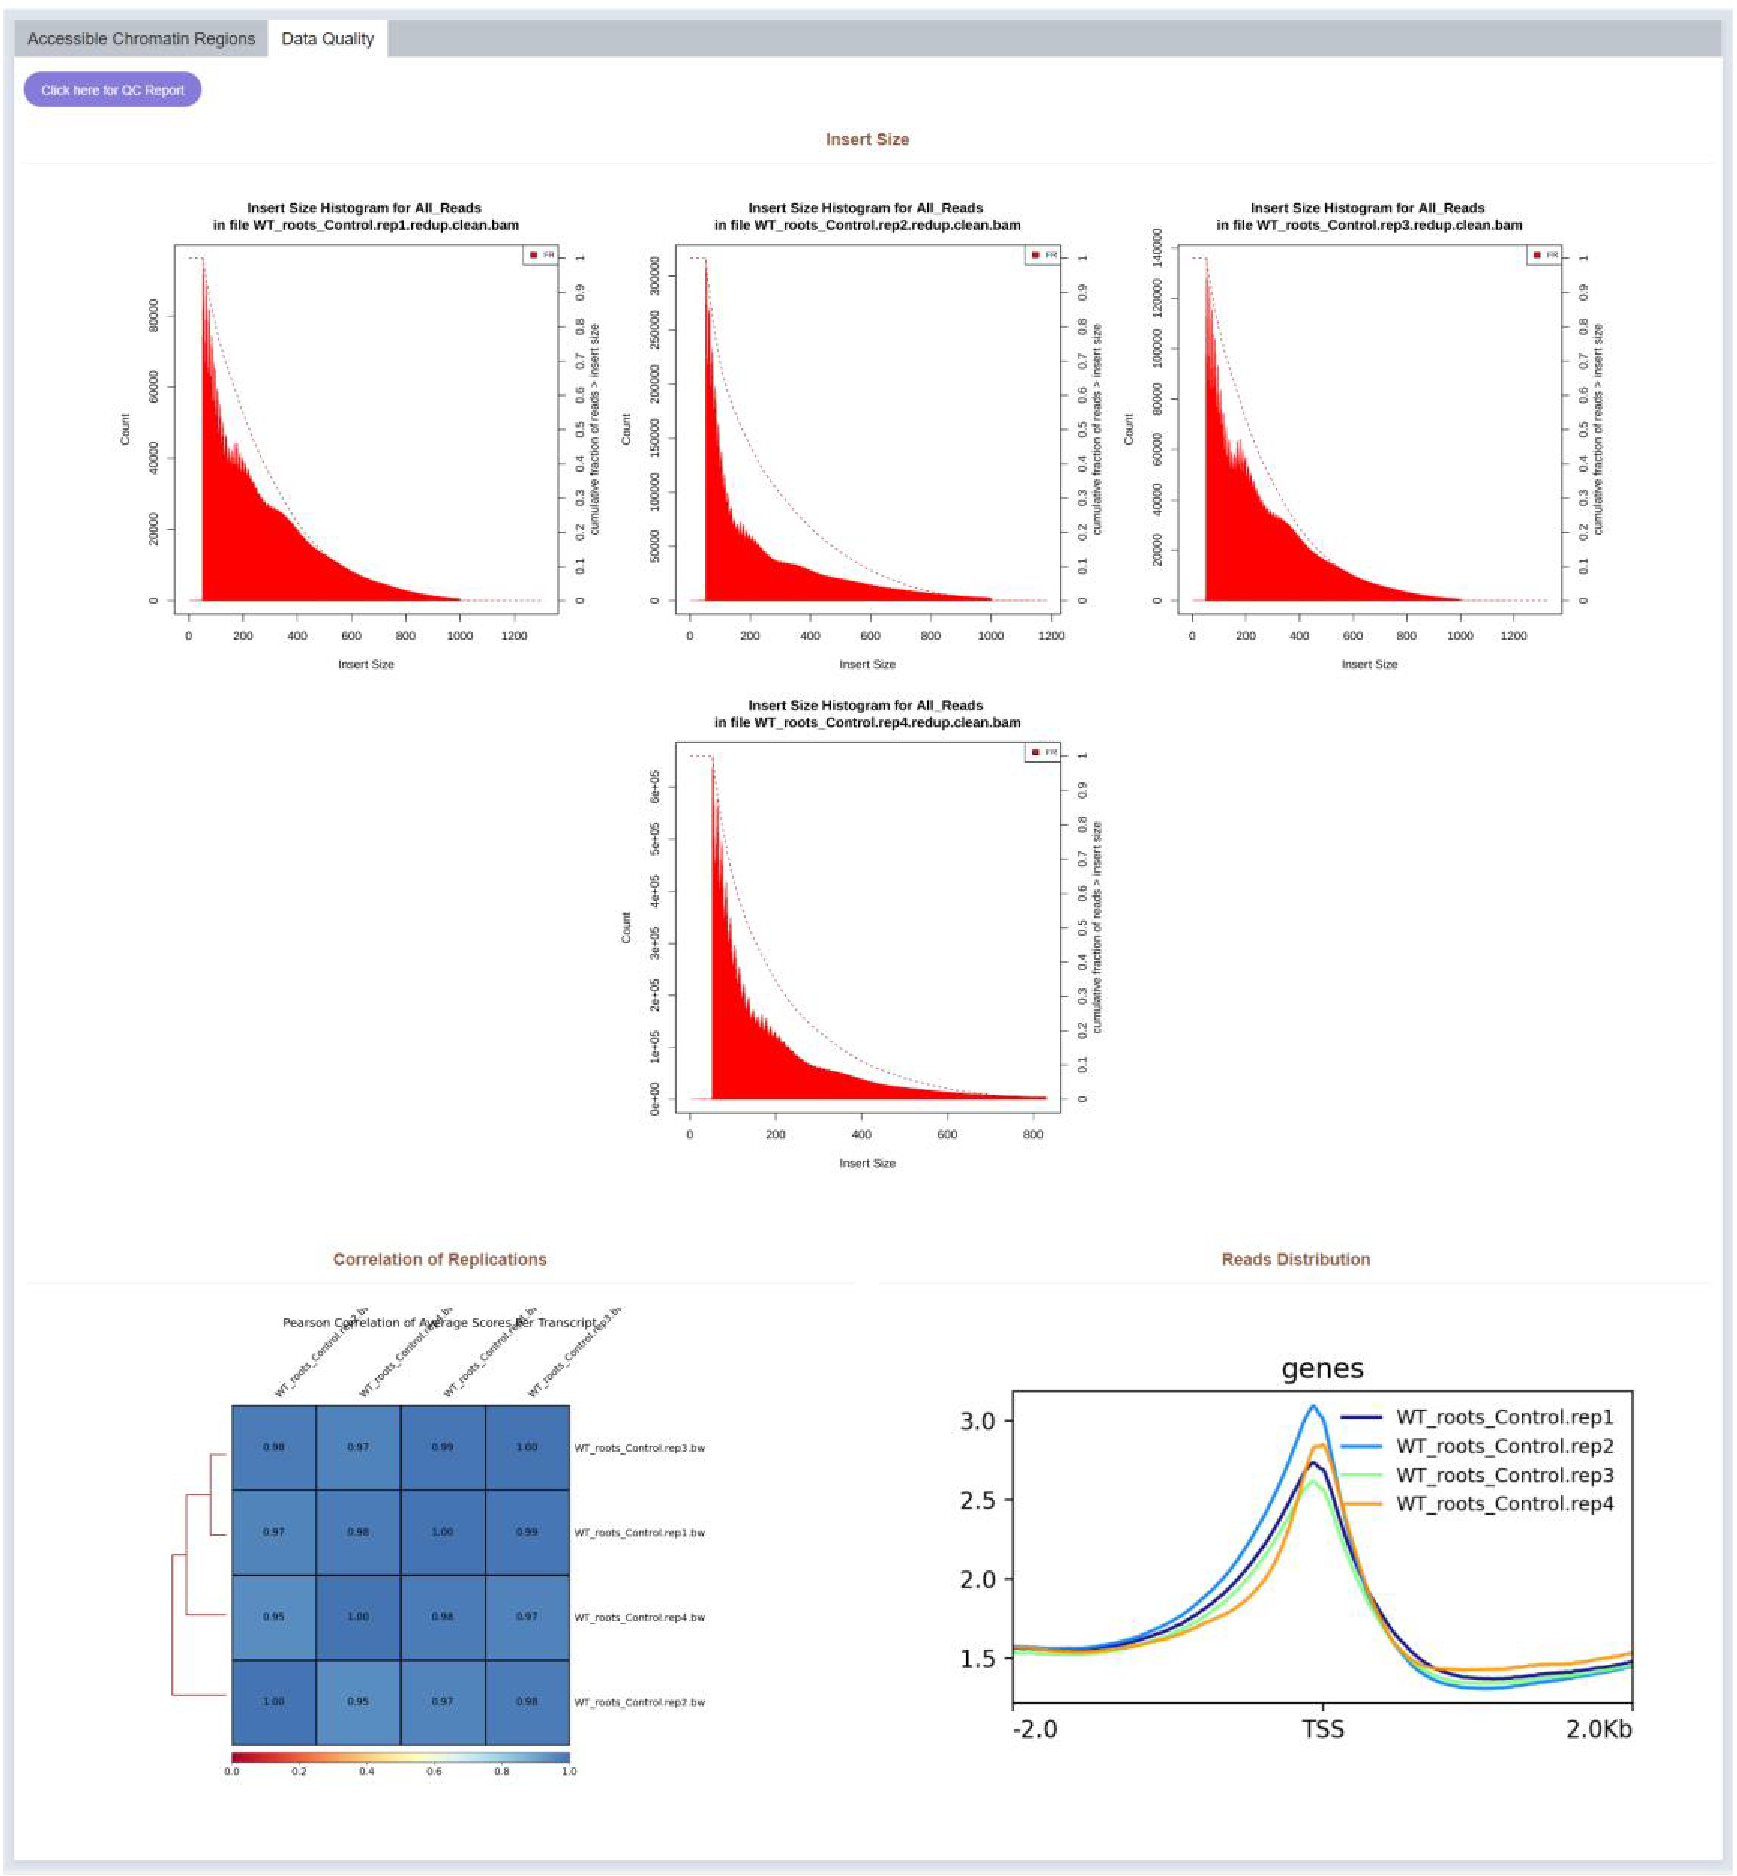
Figure 14 Data quality
Intersize, correlation and reads distribution of each replicate are visualized in the Data Quality part.
4.3 Chromatin Interaction
4.3.1 Sample Statistics Page
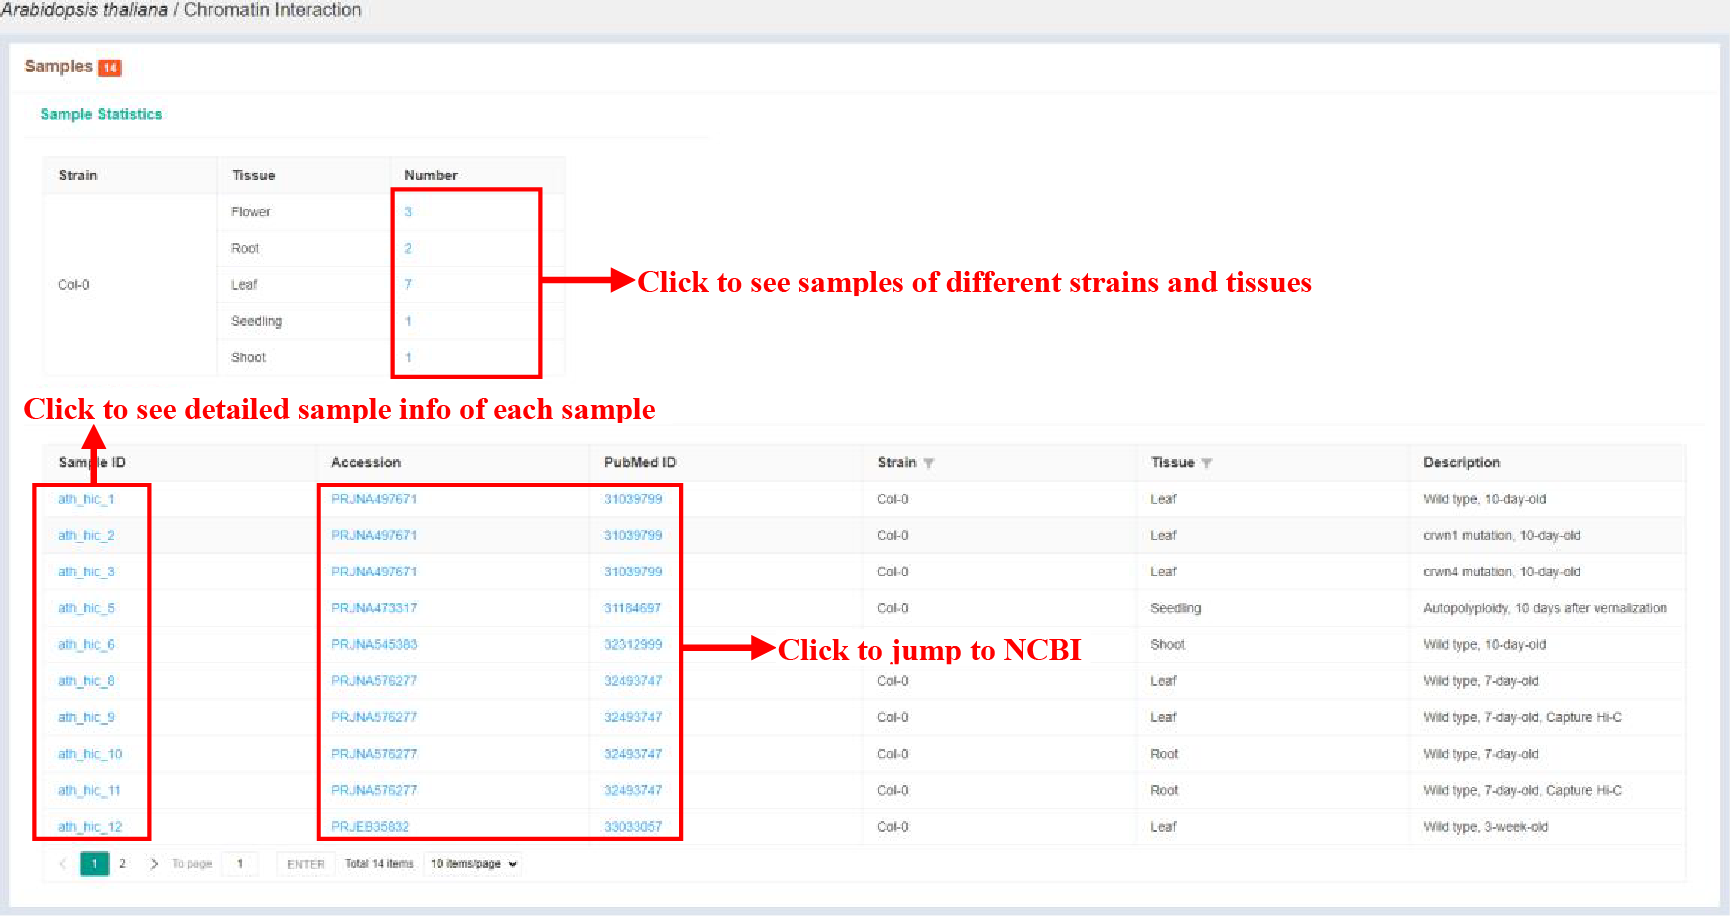
Figure 15 Sample statistics of chromatin interaction
The Sample statistics page shows the sample statistics of different strains and tissues, and lists the basic information of each sample.
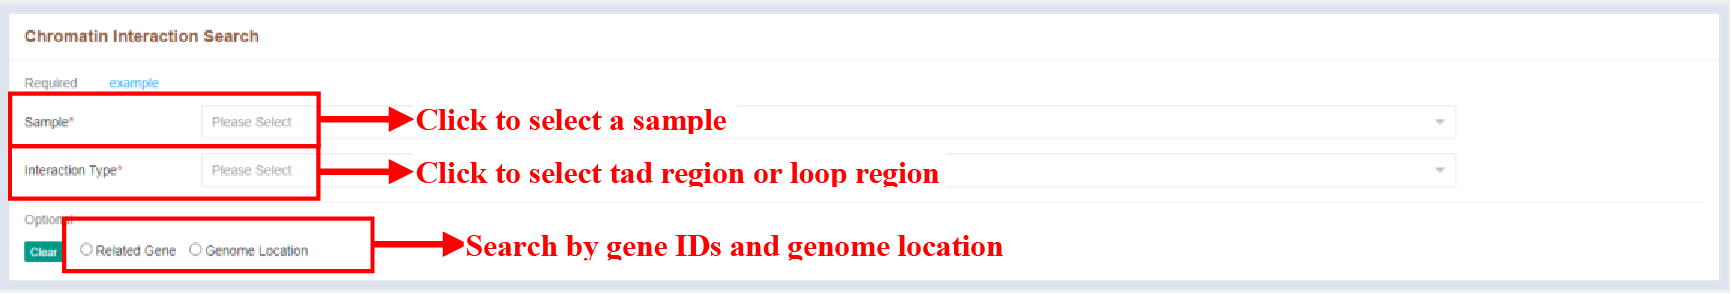
Figure 16 Search module of chromatin interaction
Search module of chromatin interaction provides the ability to search for loop regions and tad regions using gene IDs and genome location.
4.3.2 Sample Infomation Page
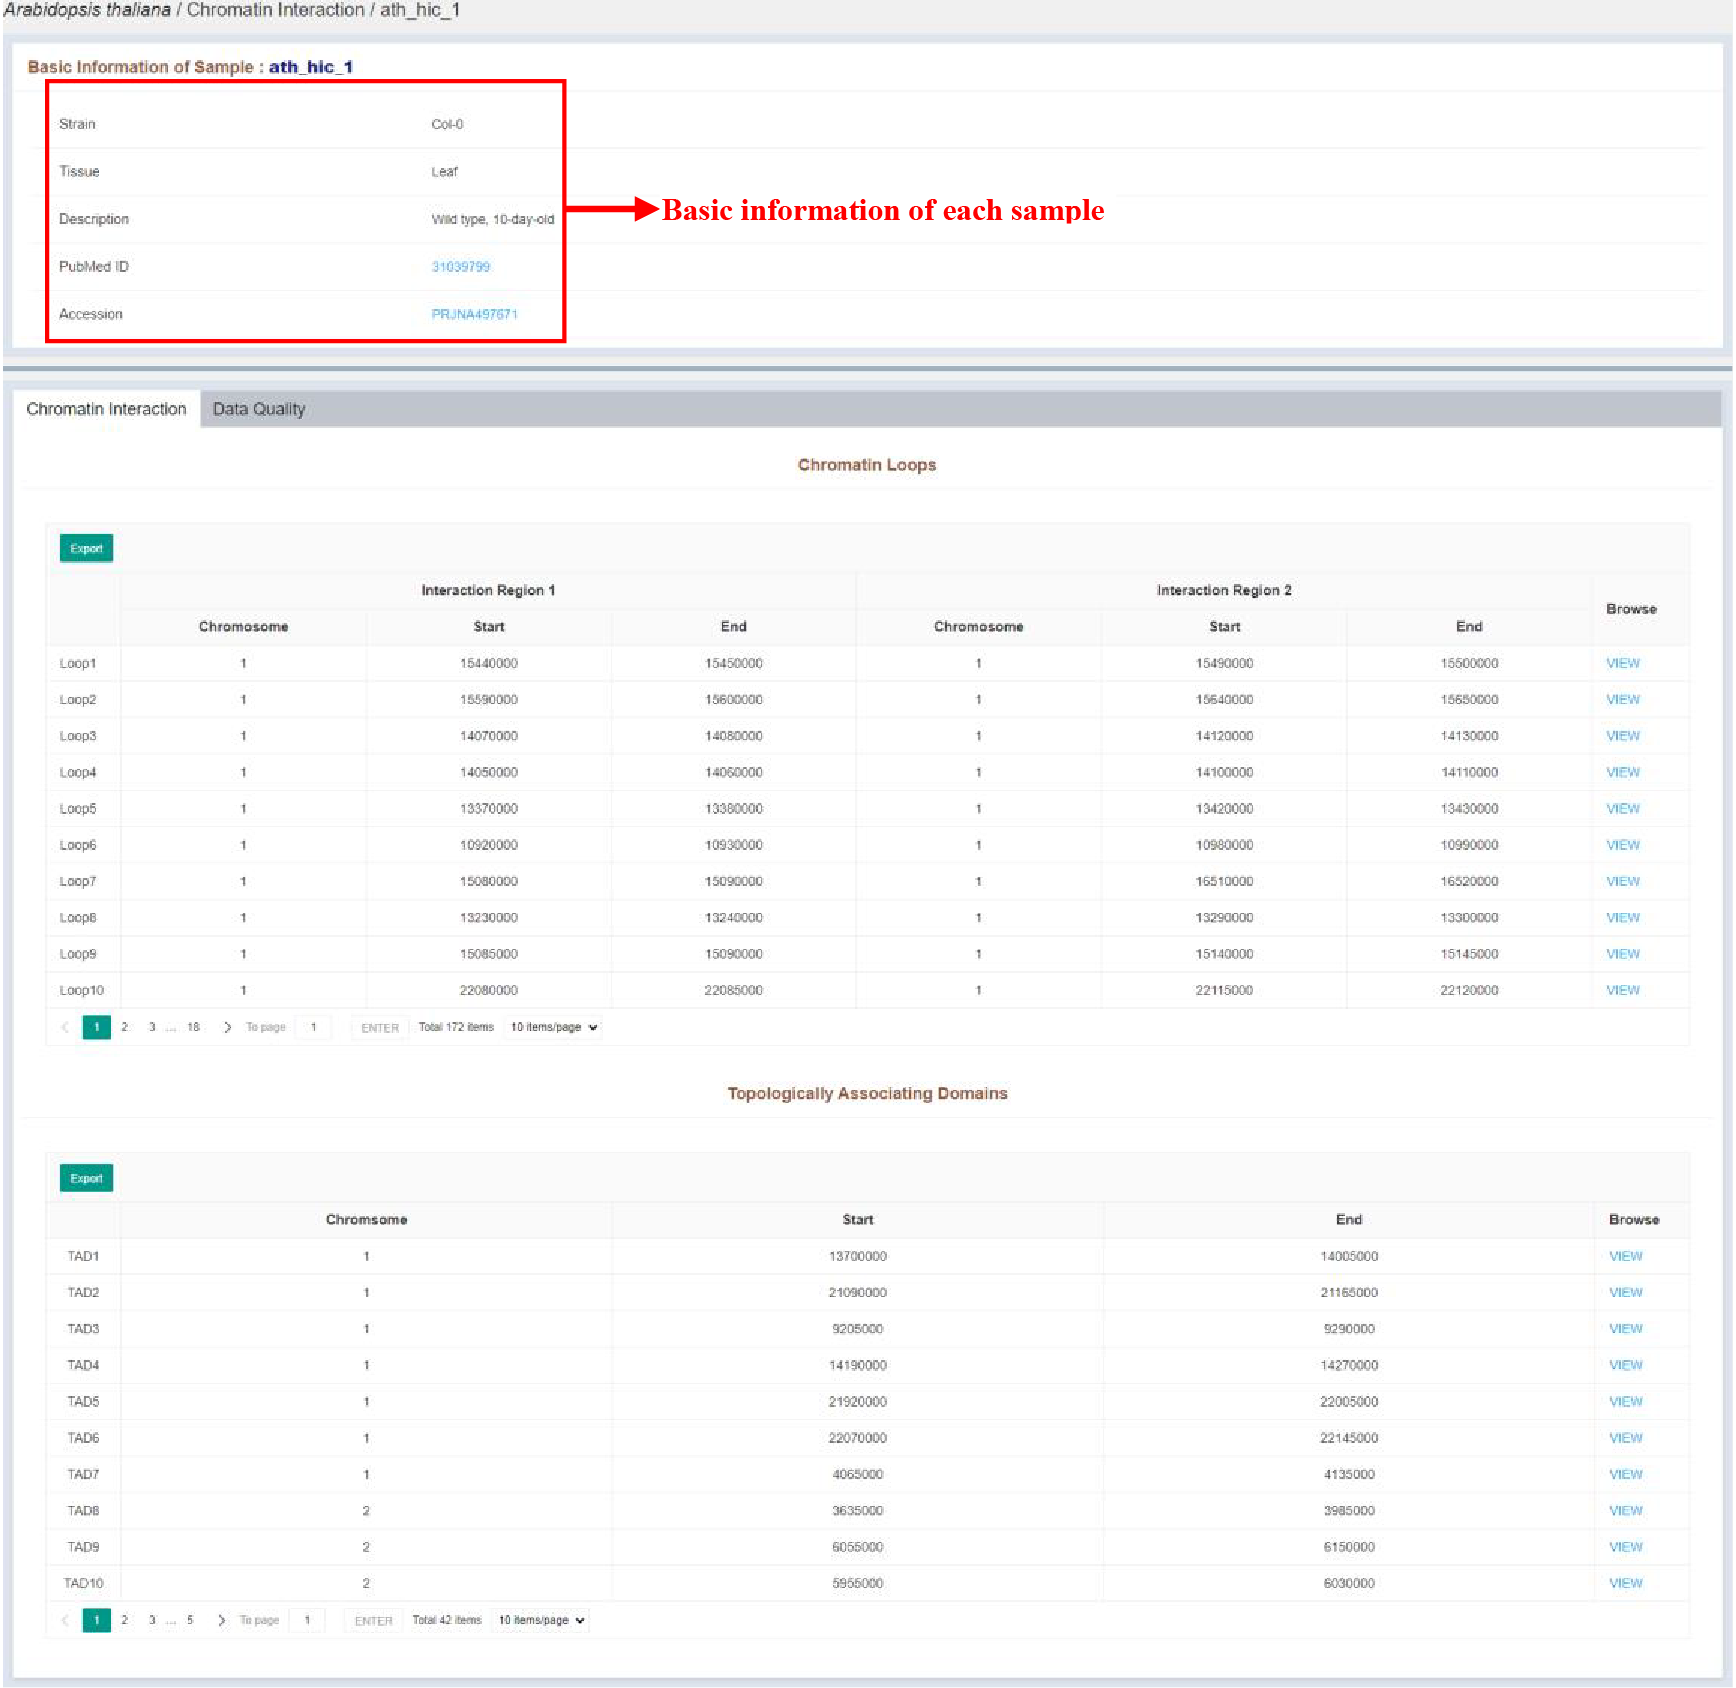
Figure 17 Sample infomation page of chromatin accessibility
Sample infomation displays the basic information of the sample. The details of each loop region and tad region are listed in the tables, which are as follows:
| Columns | Details |
|---|---|
| Chromosome (Interaction Region 1) | Chromosome of the loop region 1 |
| Start (Interaction Region 1) | Start position of the loop region 1 |
| End (Interaction Region 1) | End position of the loop region 1 |
| Chromosome (Interaction Region 2) | Chromosome of the loop region 2 |
| Start (Interaction Region 2) | Start position of the loop region 2 |
| End (Interaction Region 2) | End position of the loop region 2 |
| Columns | Details |
|---|---|
| Chromosome | Chromosome of the tad region |
| Start | Start position of the tad region |
| End | End position of the tad region |
4.4 Population Genomics
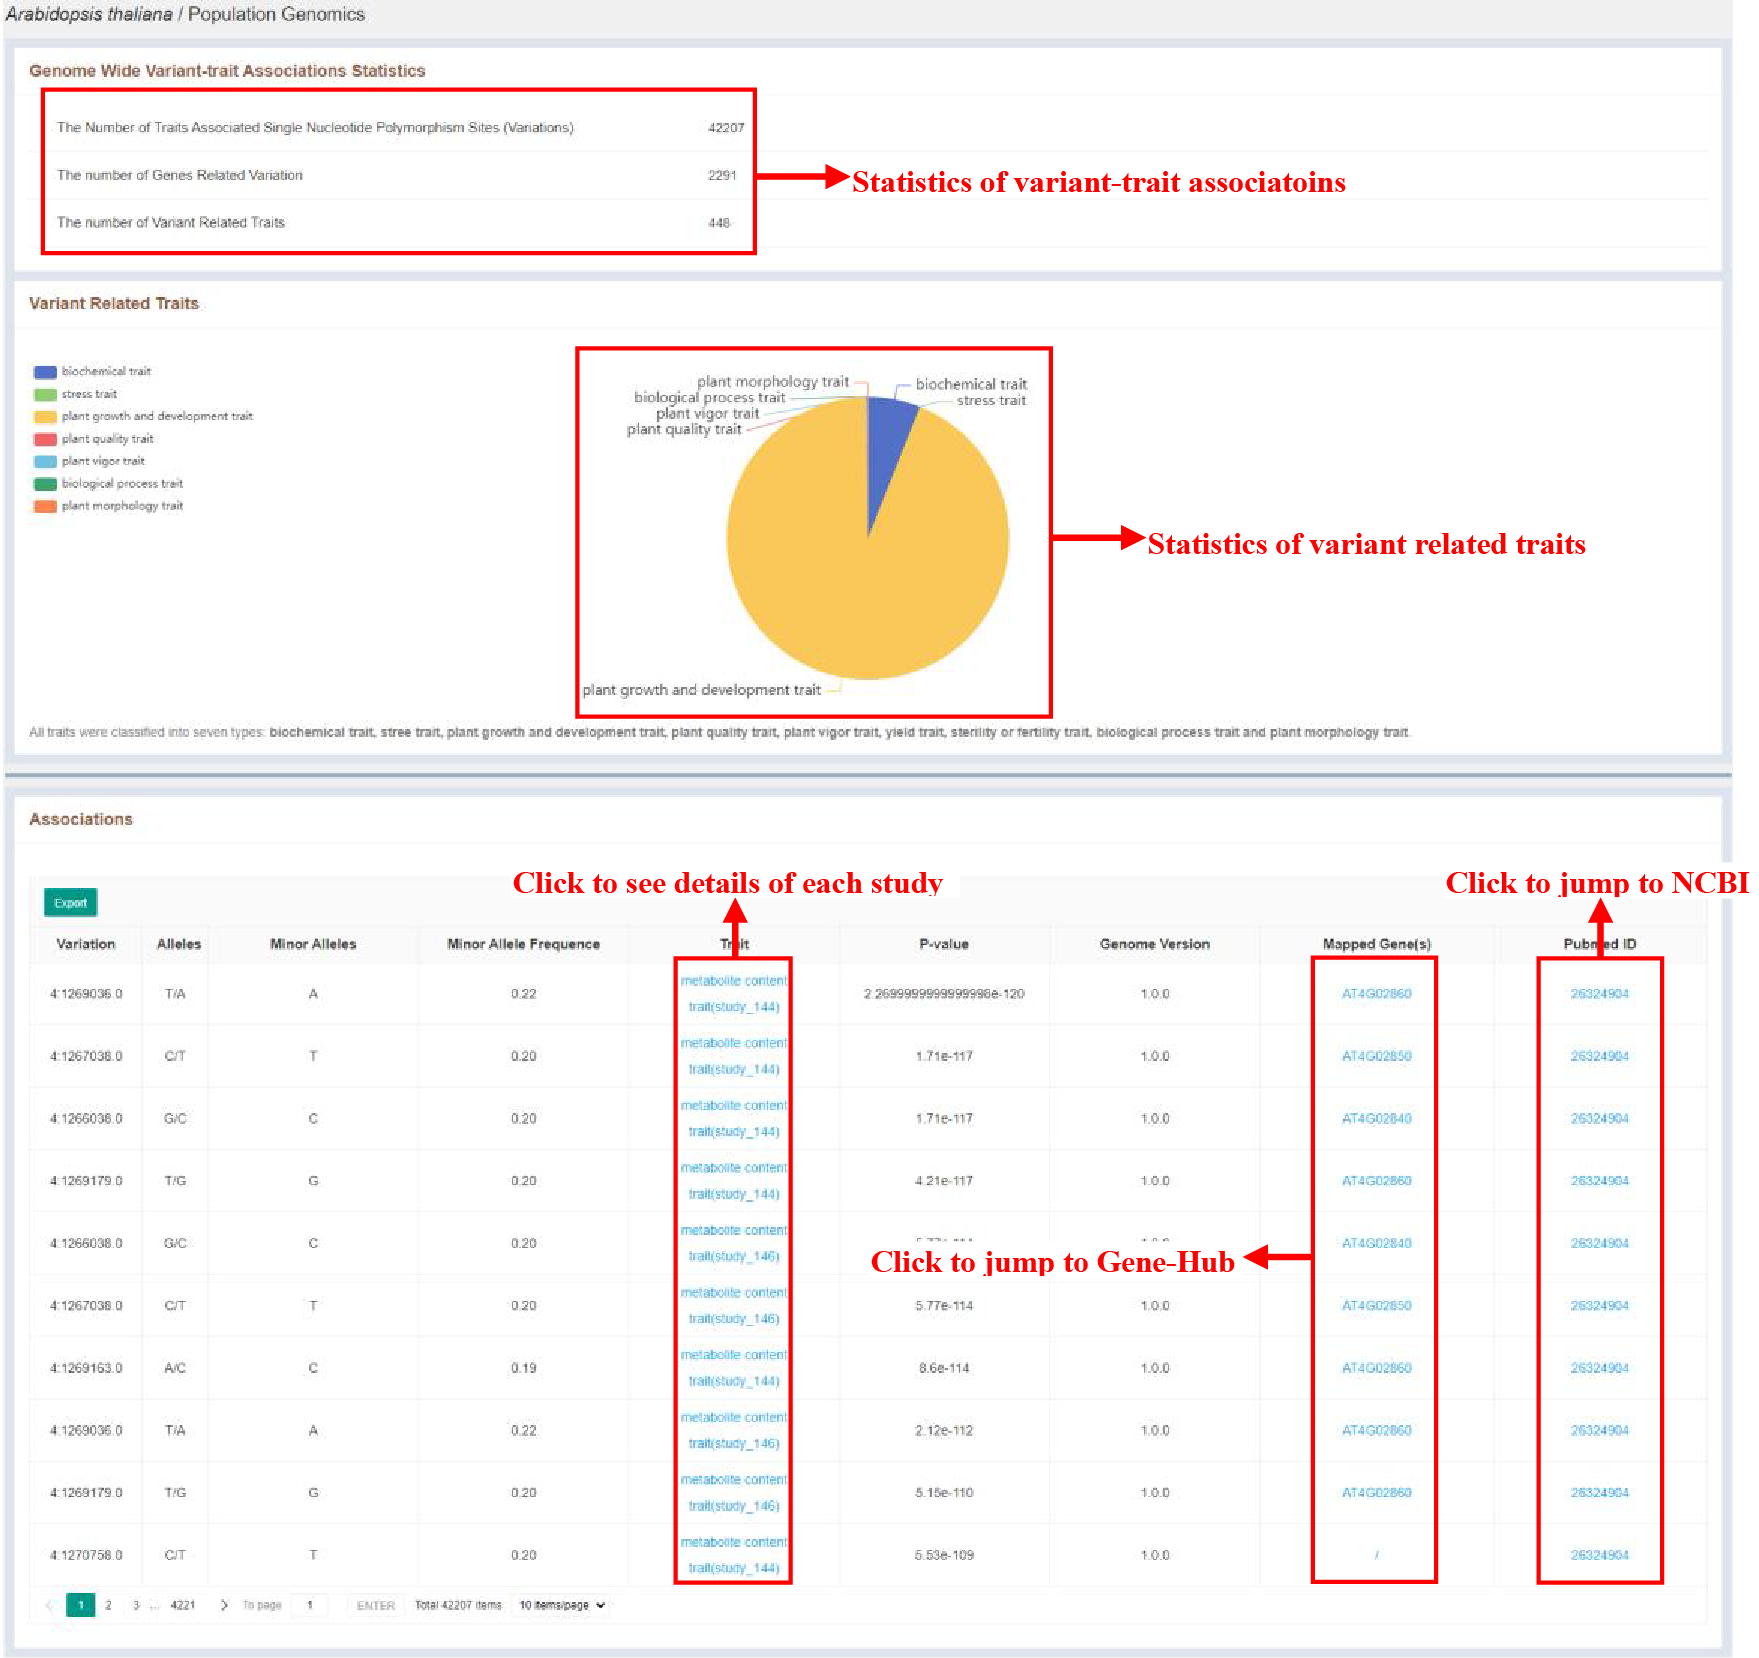
Figure 18 Genome wide variant-trait associations’ information
The population genomics page shows the sample statistics of variant-trait associatoins and variant related traits, and lists detailed information of each significant association in Associations table, which are as follows:
| Columns | Details |
|---|---|
| Variation | Position of the variation |
| Alleles | Alleles of the variation |
| Minor Alleles | Minor alleles of the variation |
| Minor Allele Frequence | Minor allele frequence of the variation |
| Trait | Trait that the variation was significantly associated to |
| P-value | P-value of the variant-trait association |
| Genome Version | Genome Version |
| Mapped Gene | Mapped gene of the variation |
| Pubmed ID | Pubmed ID of the study |
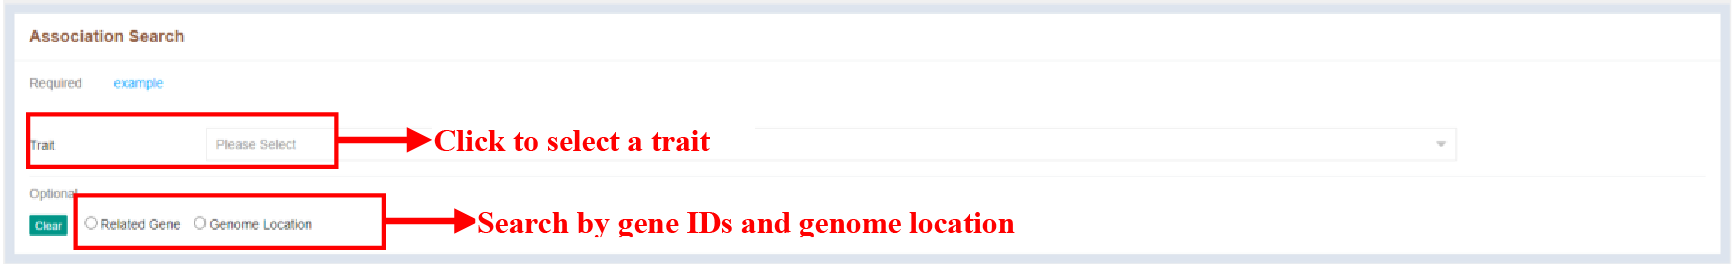
Figure 19 Search module of population genomics
Search module of population genomics provides the ability to search for variant-trait associations using gene IDs and genome location.
4.5 DNA 5mC Modification
4.5.1 Sample Statistics Page
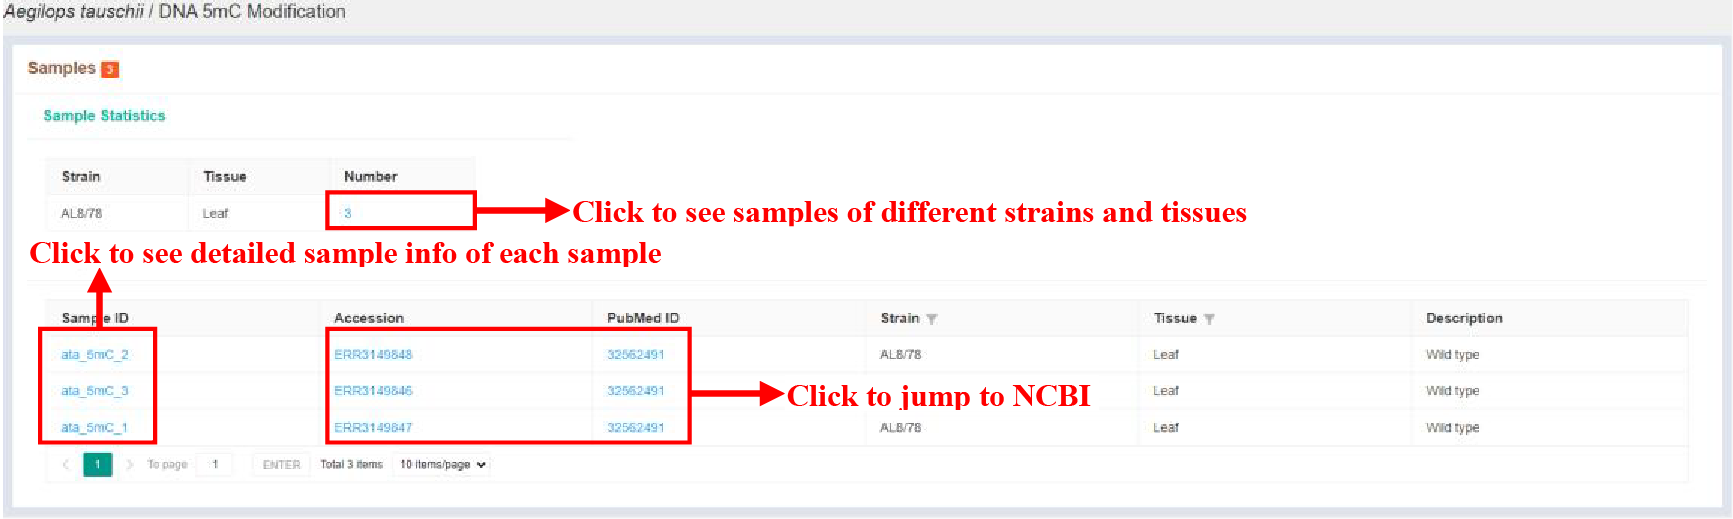
Figure 20 Sample statistics of DNA 5mC Modification
The Sample statistics page shows the sample statistics of different strains and tissues, and lists the basic information of each sample.
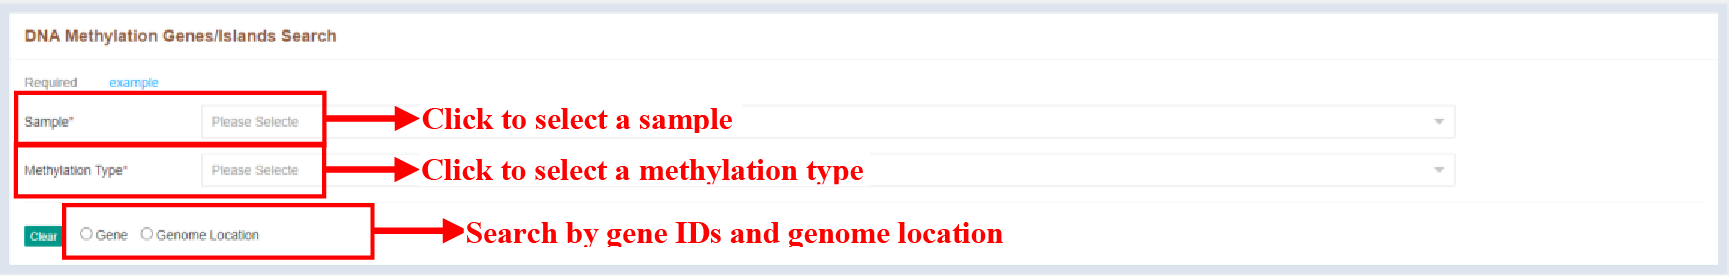
Figure 21 Search module of DNA 5mC modification
Search module of DNA 5mC modification provides the ability to search for DNA 5mC modified genes using gene IDs and genome location.
4.5.2 Sample Infomation Page
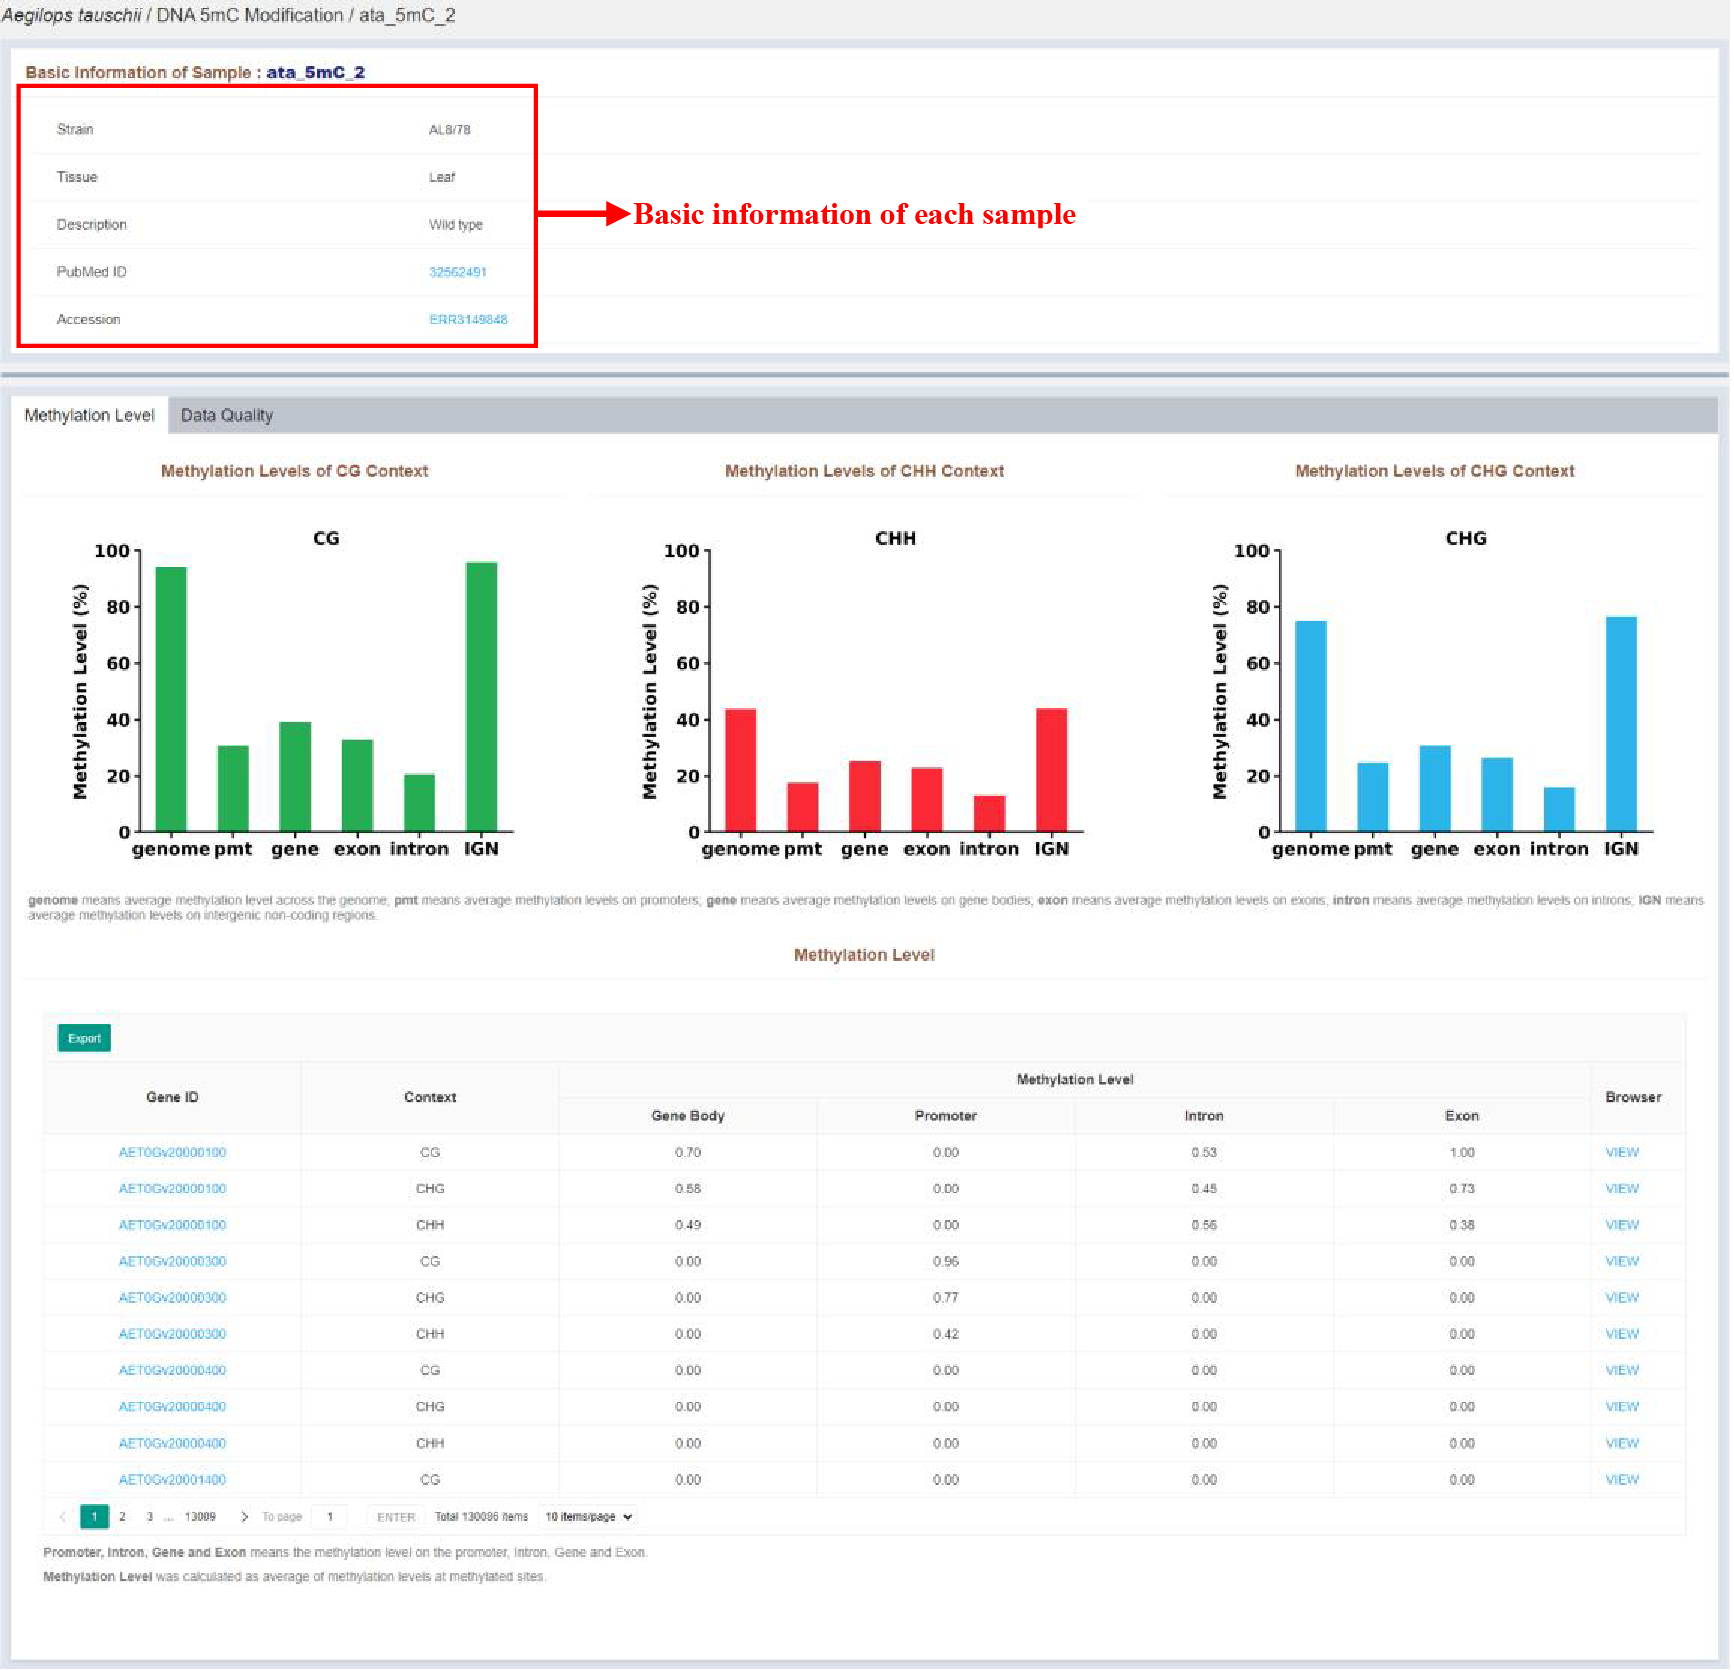
Figure 22 Sample infomation page of DNA 5mC modification
Sample infomation displays the basic information of the sample. Statisitcs of each type methylation level is displayed in barplot. The details of each DNA 5mC modified gene are listed in the tables, which are as follows:
| Columns | Details |
|---|---|
| Gene ID | DNA 5mC methylated gene ID |
| Context | DNA 5mC methylation type |
| Gene Body | Methylation type of gene body |
| Promoter | Methylation level of gene promoter |
| Intron | Methylation level of gene intron |
| Exon | Methylation level of gene exon |
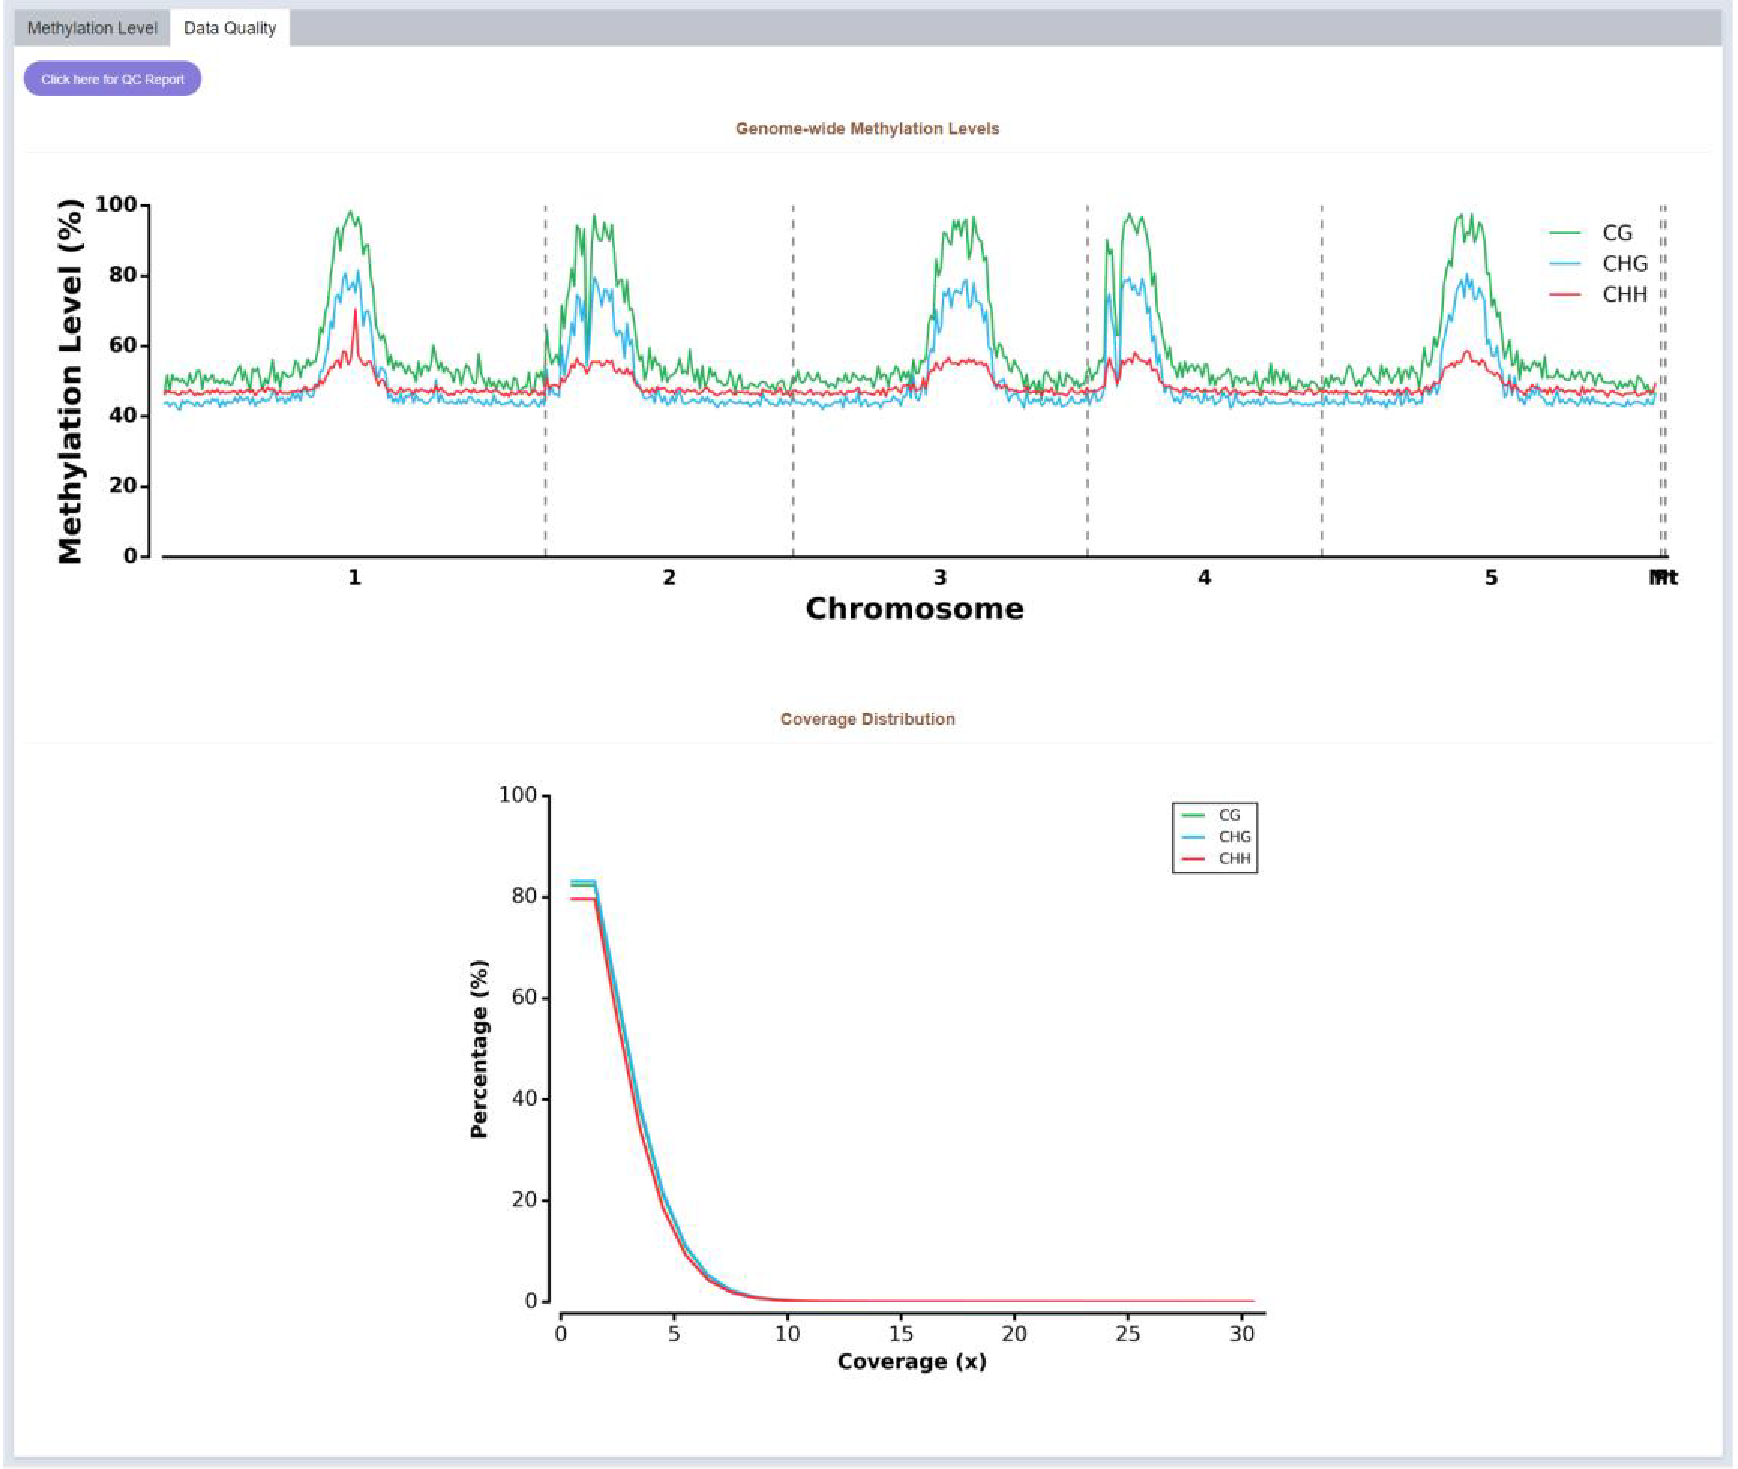
Figure 23 Data quality of DNA 5mC modification
Coverage distribution of each methylation type and genome-wide methylation level are visualized in the data quality part.
4.6 Transcriptome
4.6.1 Sample Statistics Page
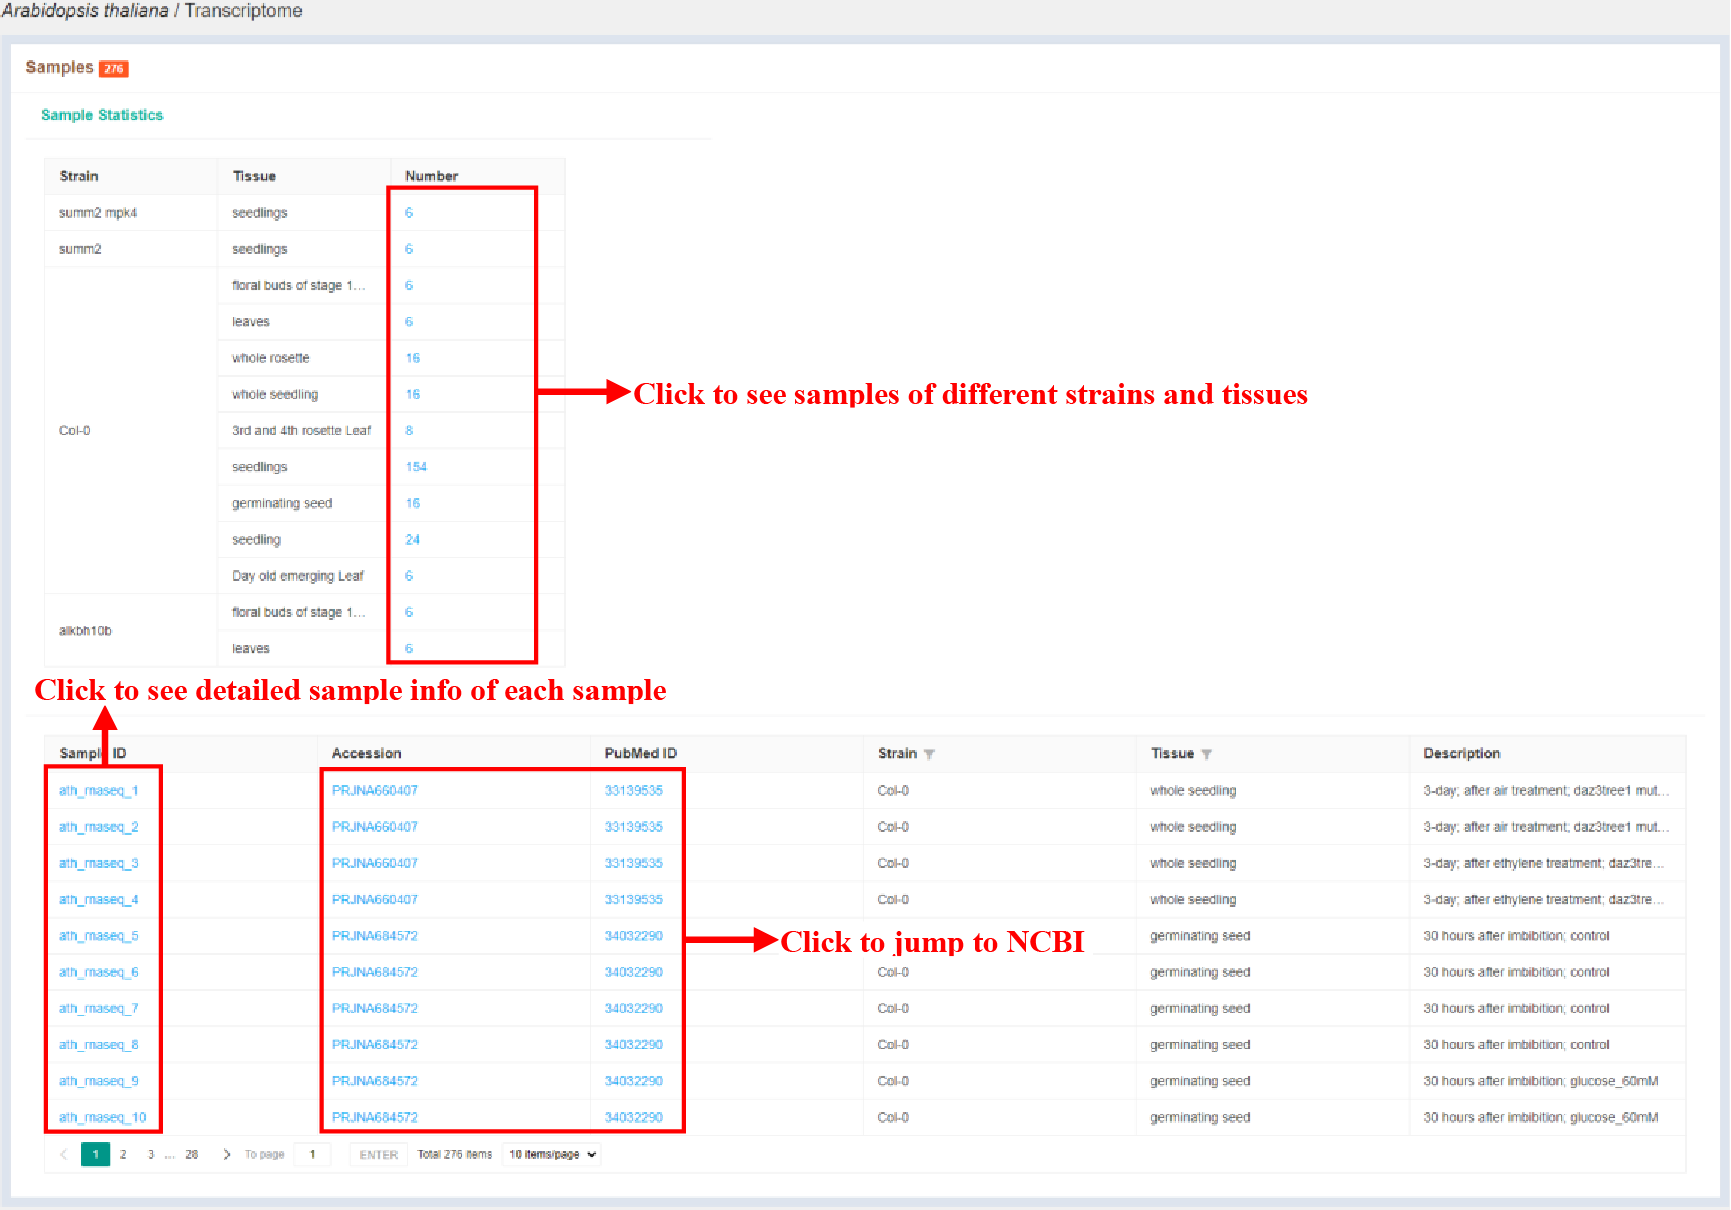
Figure 24 Sample statistics of transcriptome
The Sample statistics page shows the sample statistics of different strains and tissues, and lists the basic information of each sample.
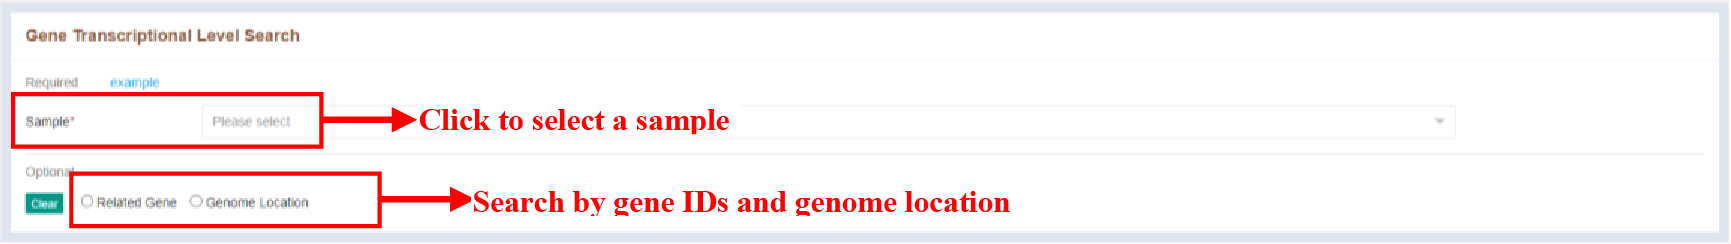
Figure 25 Search module of transcriptome
Search module of transcriptome provides the ability to search for expression level of genes using gene IDs and genome location.
4.6.2 Sample Infomation Page
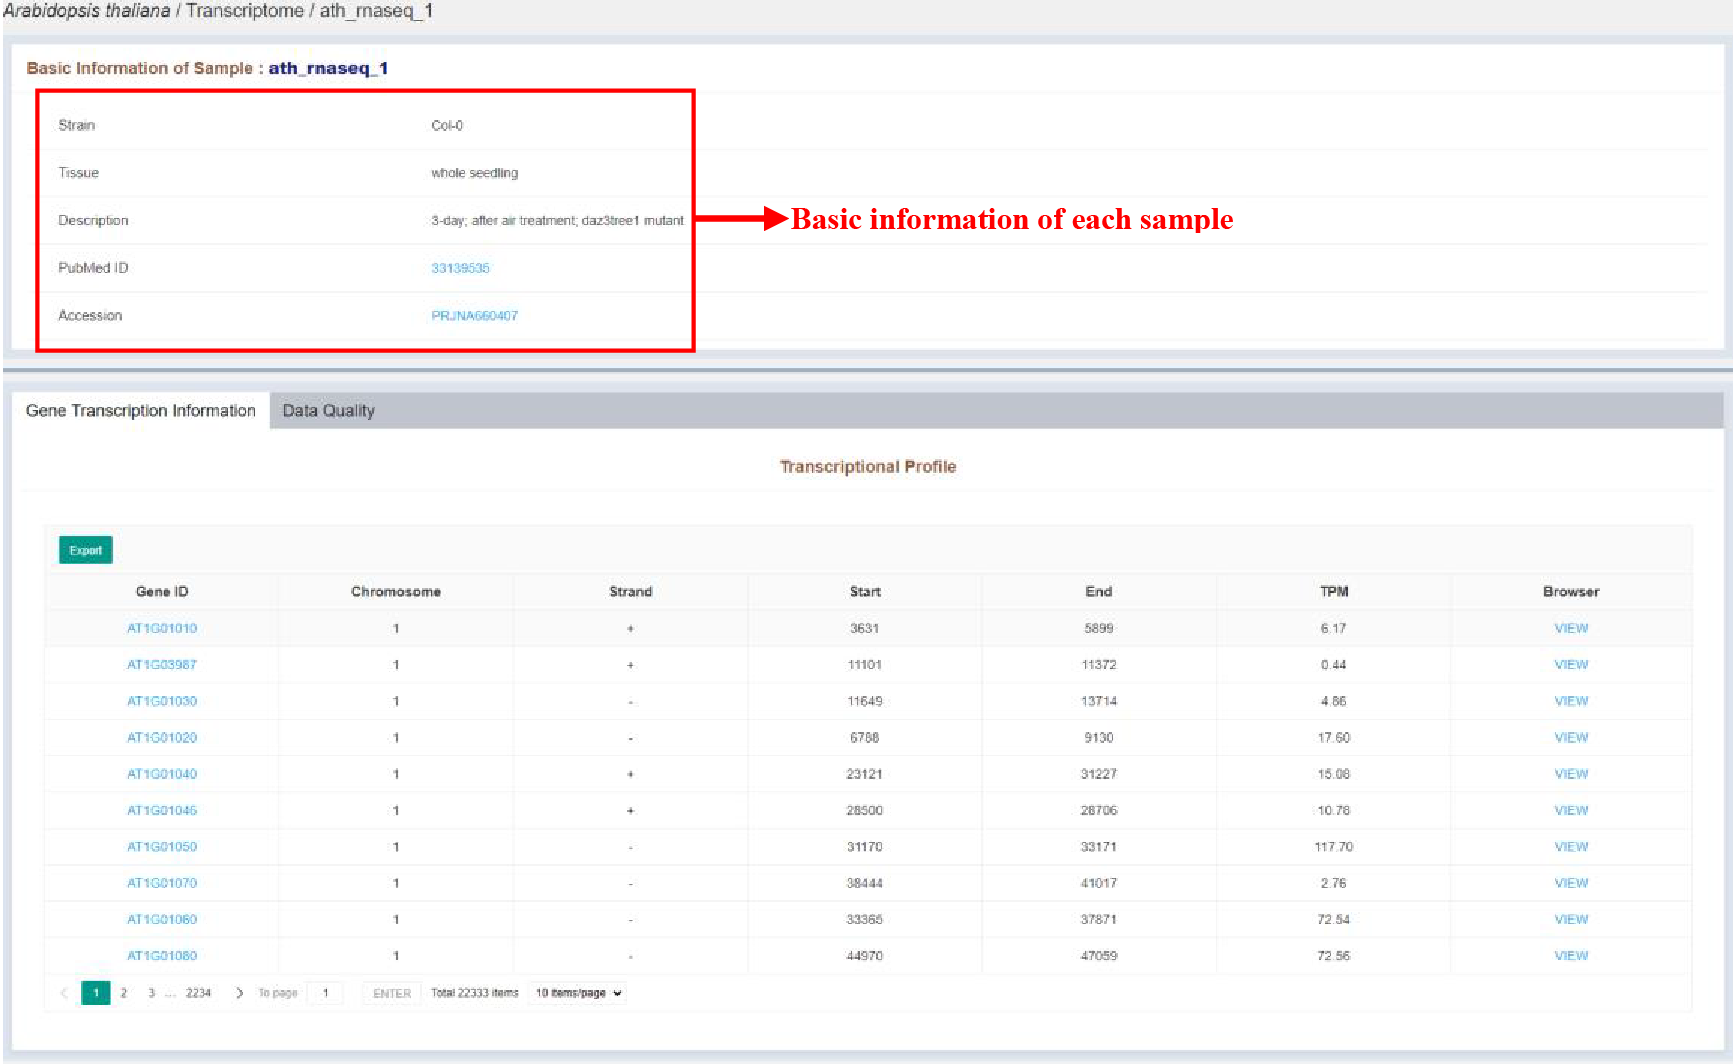
Figure 26 Sample infomation page of transcriptome
Sample infomation displays the basic information of the sample. The details of each gene are listed in the tables, which are as follows:
| Columns | Details |
|---|---|
| Gene ID | Gene ID |
| Chromosome | Chromosome of the expression gene |
| Strand | Strand of the expression gene |
| Start | Start position of the expression gene |
| End | End position of the expression gene |
| TPM | Expression level of the expression gene |
4.7 RNA m6A Modification
4.7.1 Sample Statistics Page
Figure 27 Sample statistics of RNA m6A modification
The Sample statistics page shows the sample statistics of different strains and tissues, and lists the basic information of each sample.
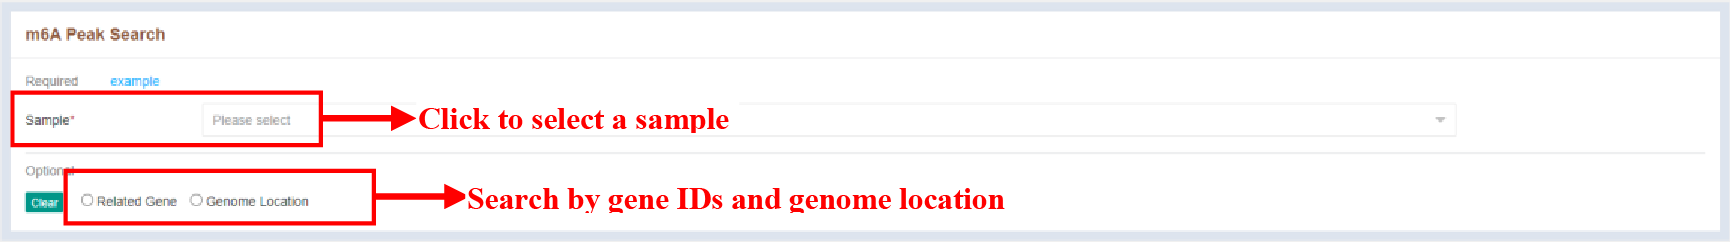
Figure 28 Search module of transcriptome
Search module of transcriptome provides the ability to search for m6A peaks using gene IDs and genome location.
4.7.2 Sample Infomation Page
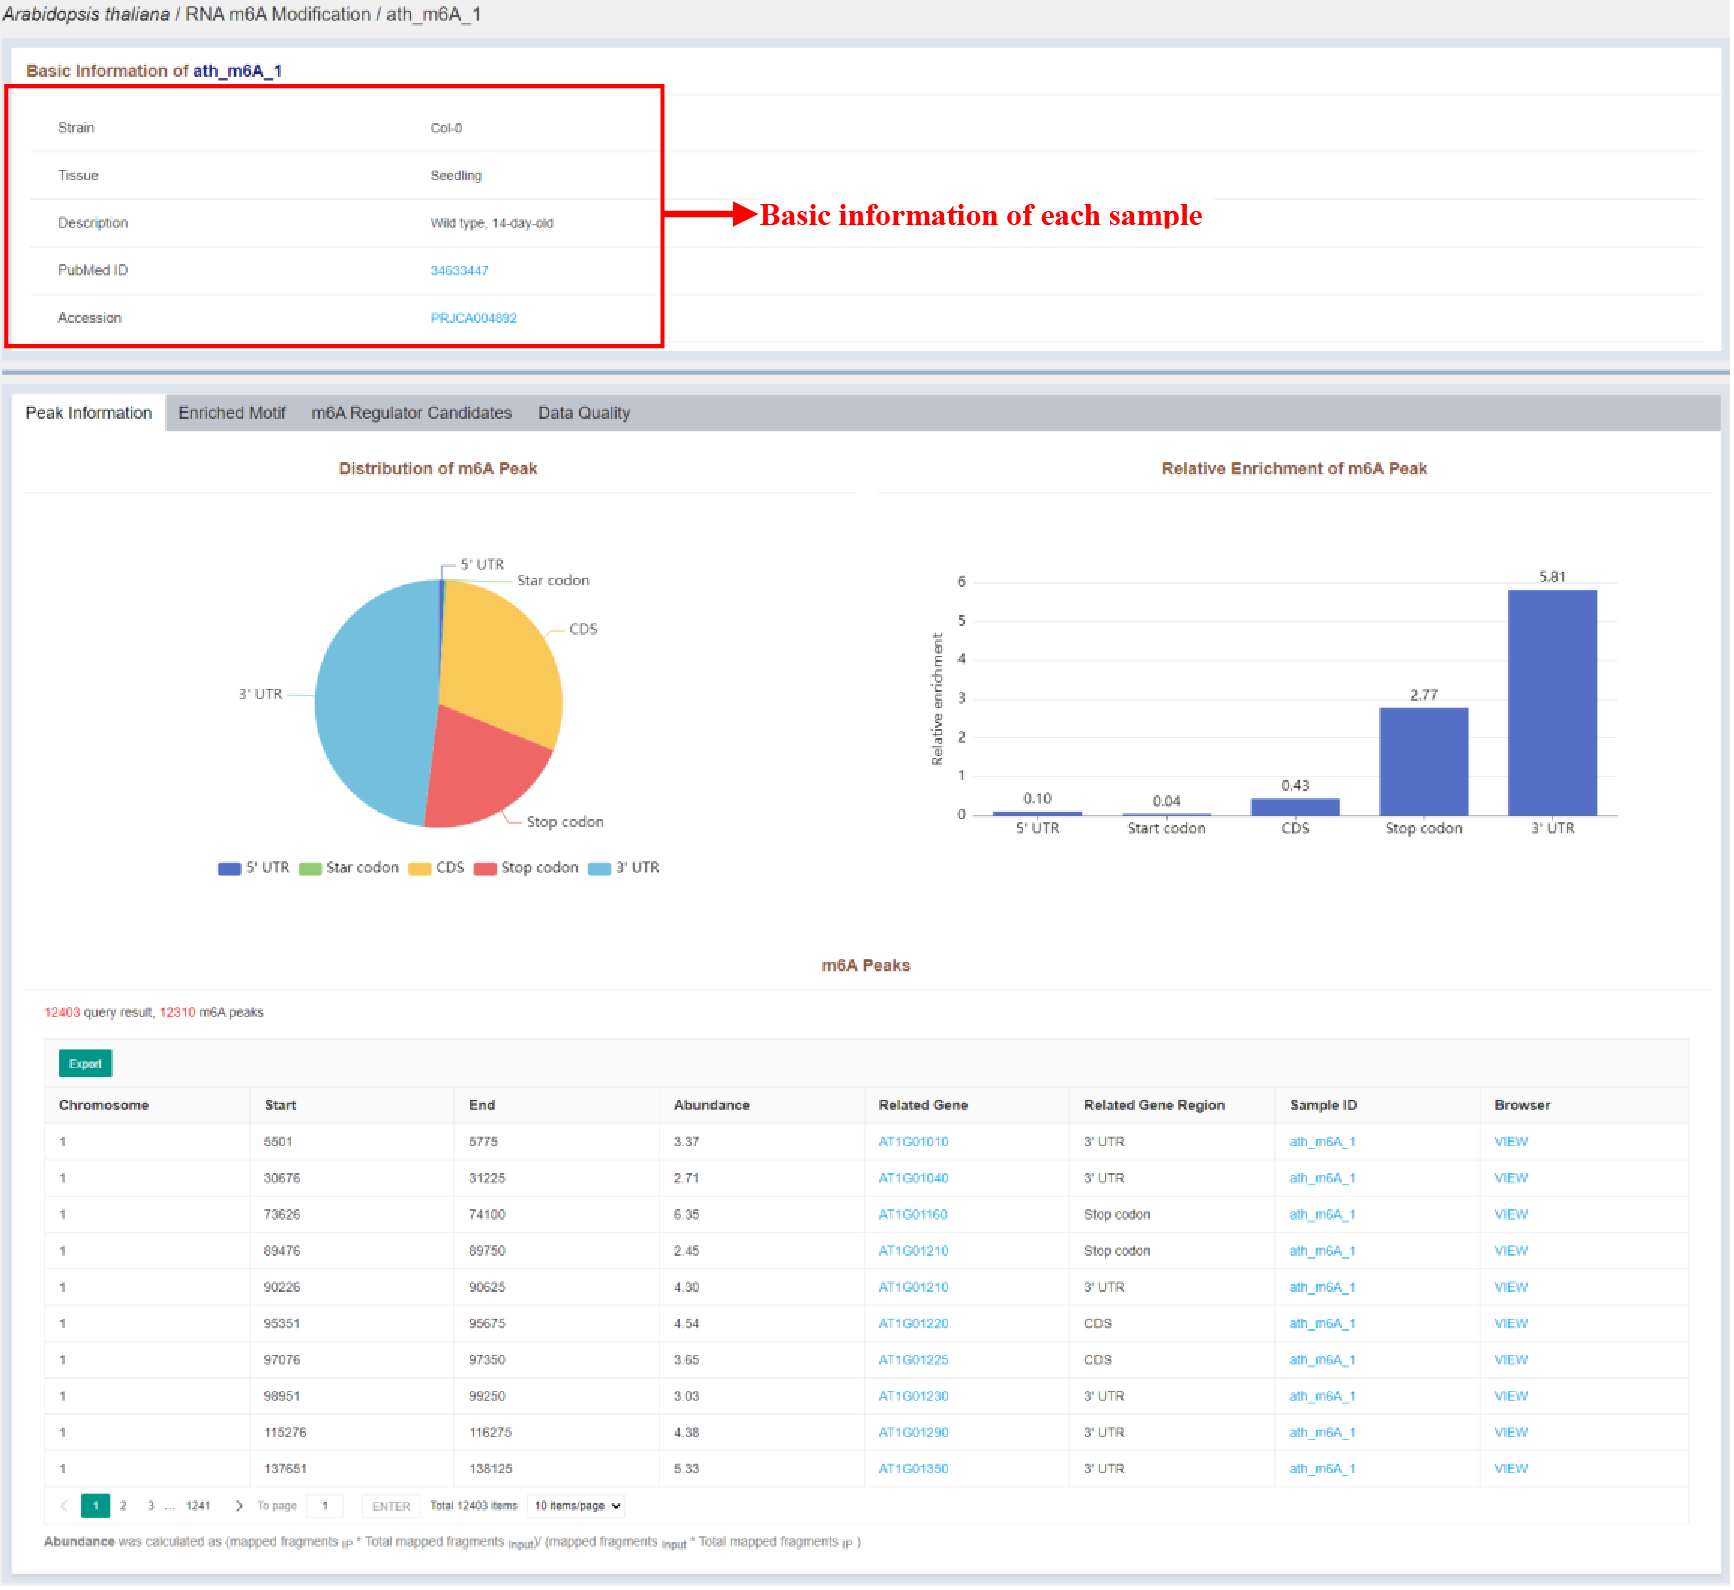
Figure 29 Sample infomation page of RNA m6A modification
Sample infomation displays the basic information of the sample and the statistics of the distribution of peaks identified in the sample. The details of each peak are listed in the tables, which are as follows:
| Columns | Details |
|---|---|
| Chromosome | Chromosome of the m6A peak |
| Start | Start position of the m6A peak |
| End | End position of the m6A peak |
| Abundance | Abundance of the m6A peak |
| Related Gene | Related gene of the m6A peak |
| Related Gene Region | Related gene region of the m6A peak |
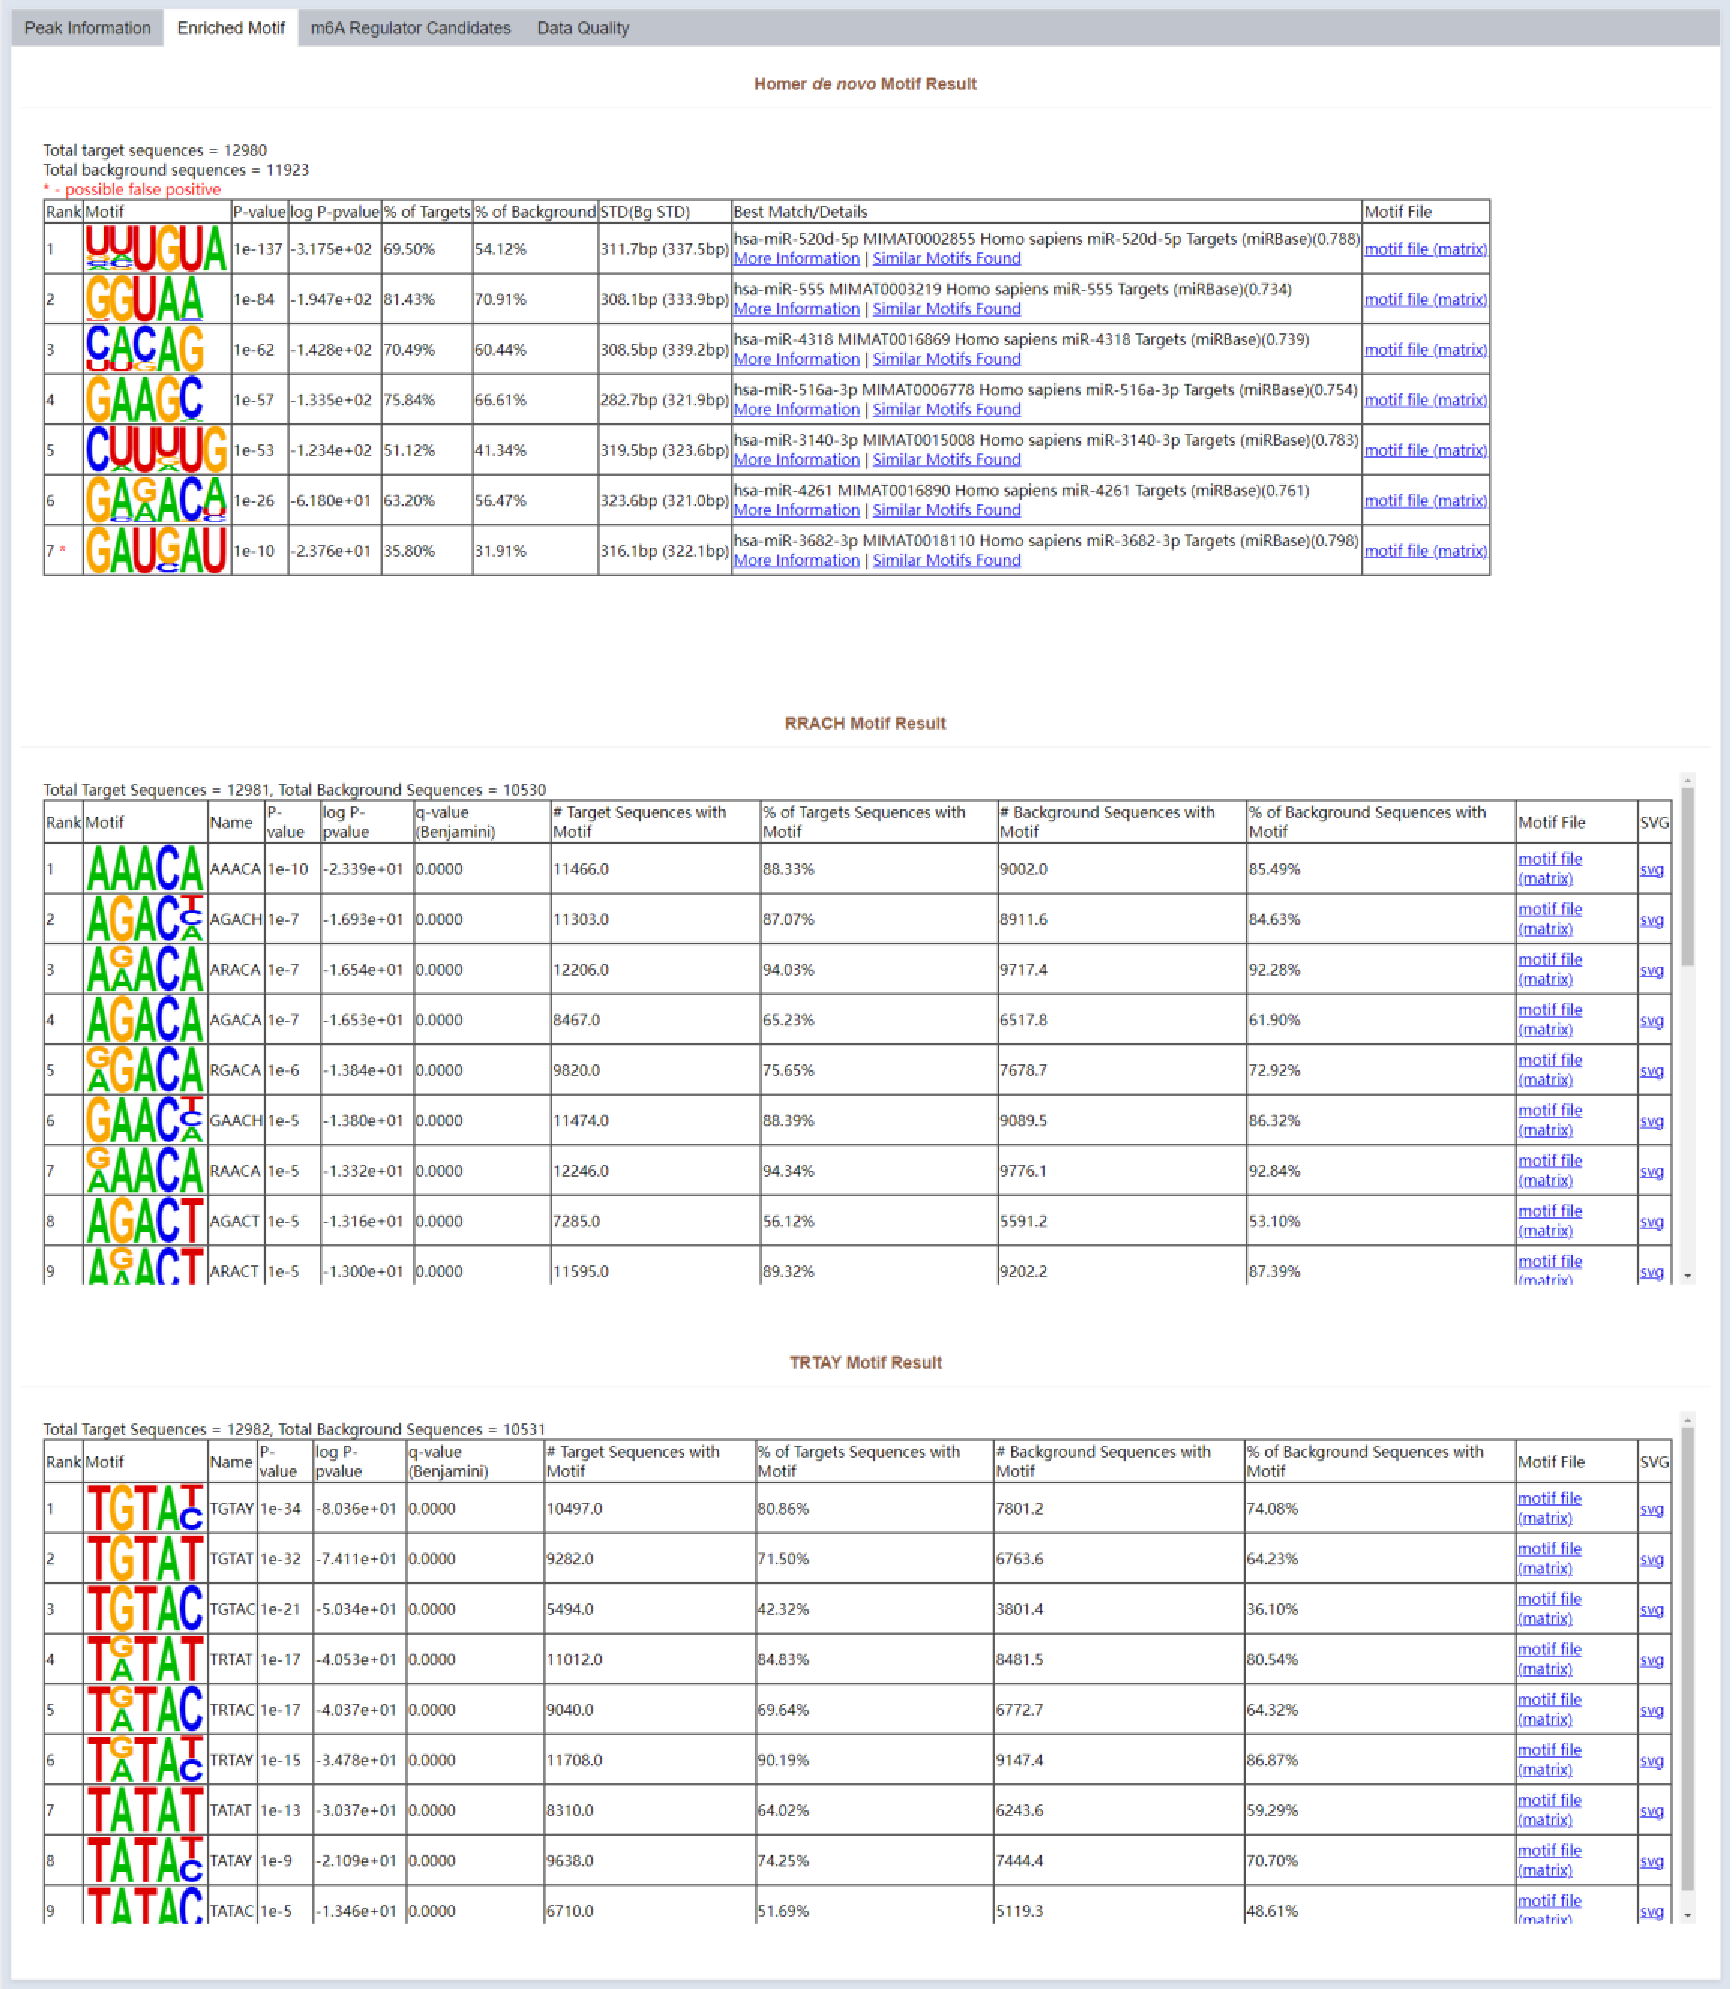
Figure 30 Enriched motif
Enriched motifs of m6A peaks in the sample are listed in Enriched Motif part.
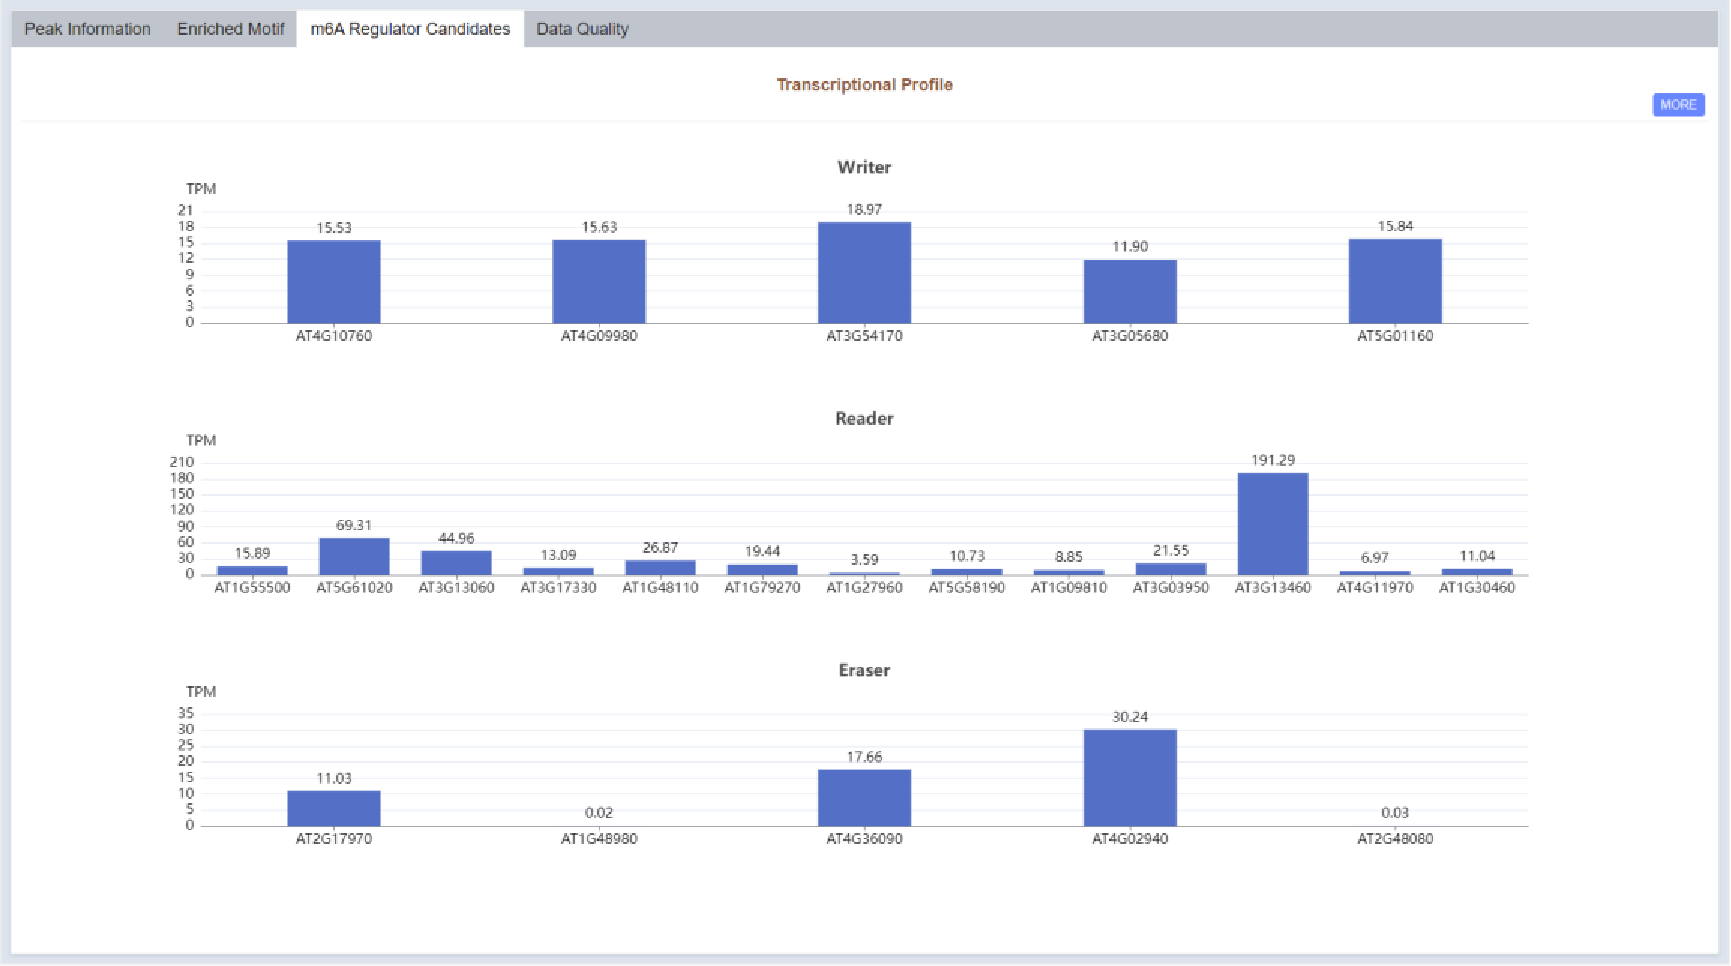
Figure 31 m6A regulator candidates
Transcriptional profile of m6A regulator candidate genes is displayed in bar plot in the m6A Regulator Candidates part.
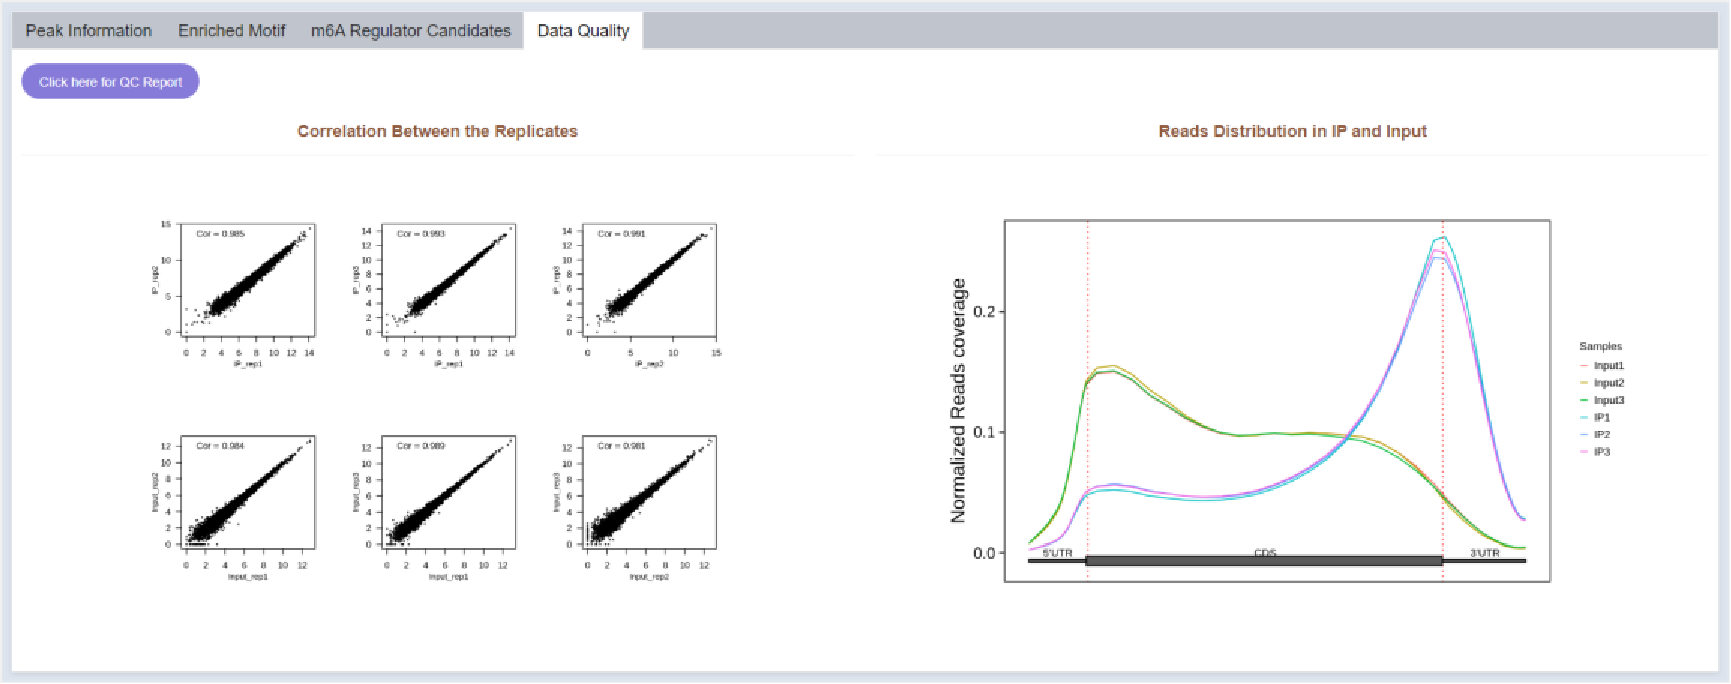
Figure 32 Data quality
Reads distribution and correlation between replicates of the sample are visualized in Data Quality part.
5 Tools
5.1 Omics Comparison Analysis Utility
5.1.1 Submit Tasks
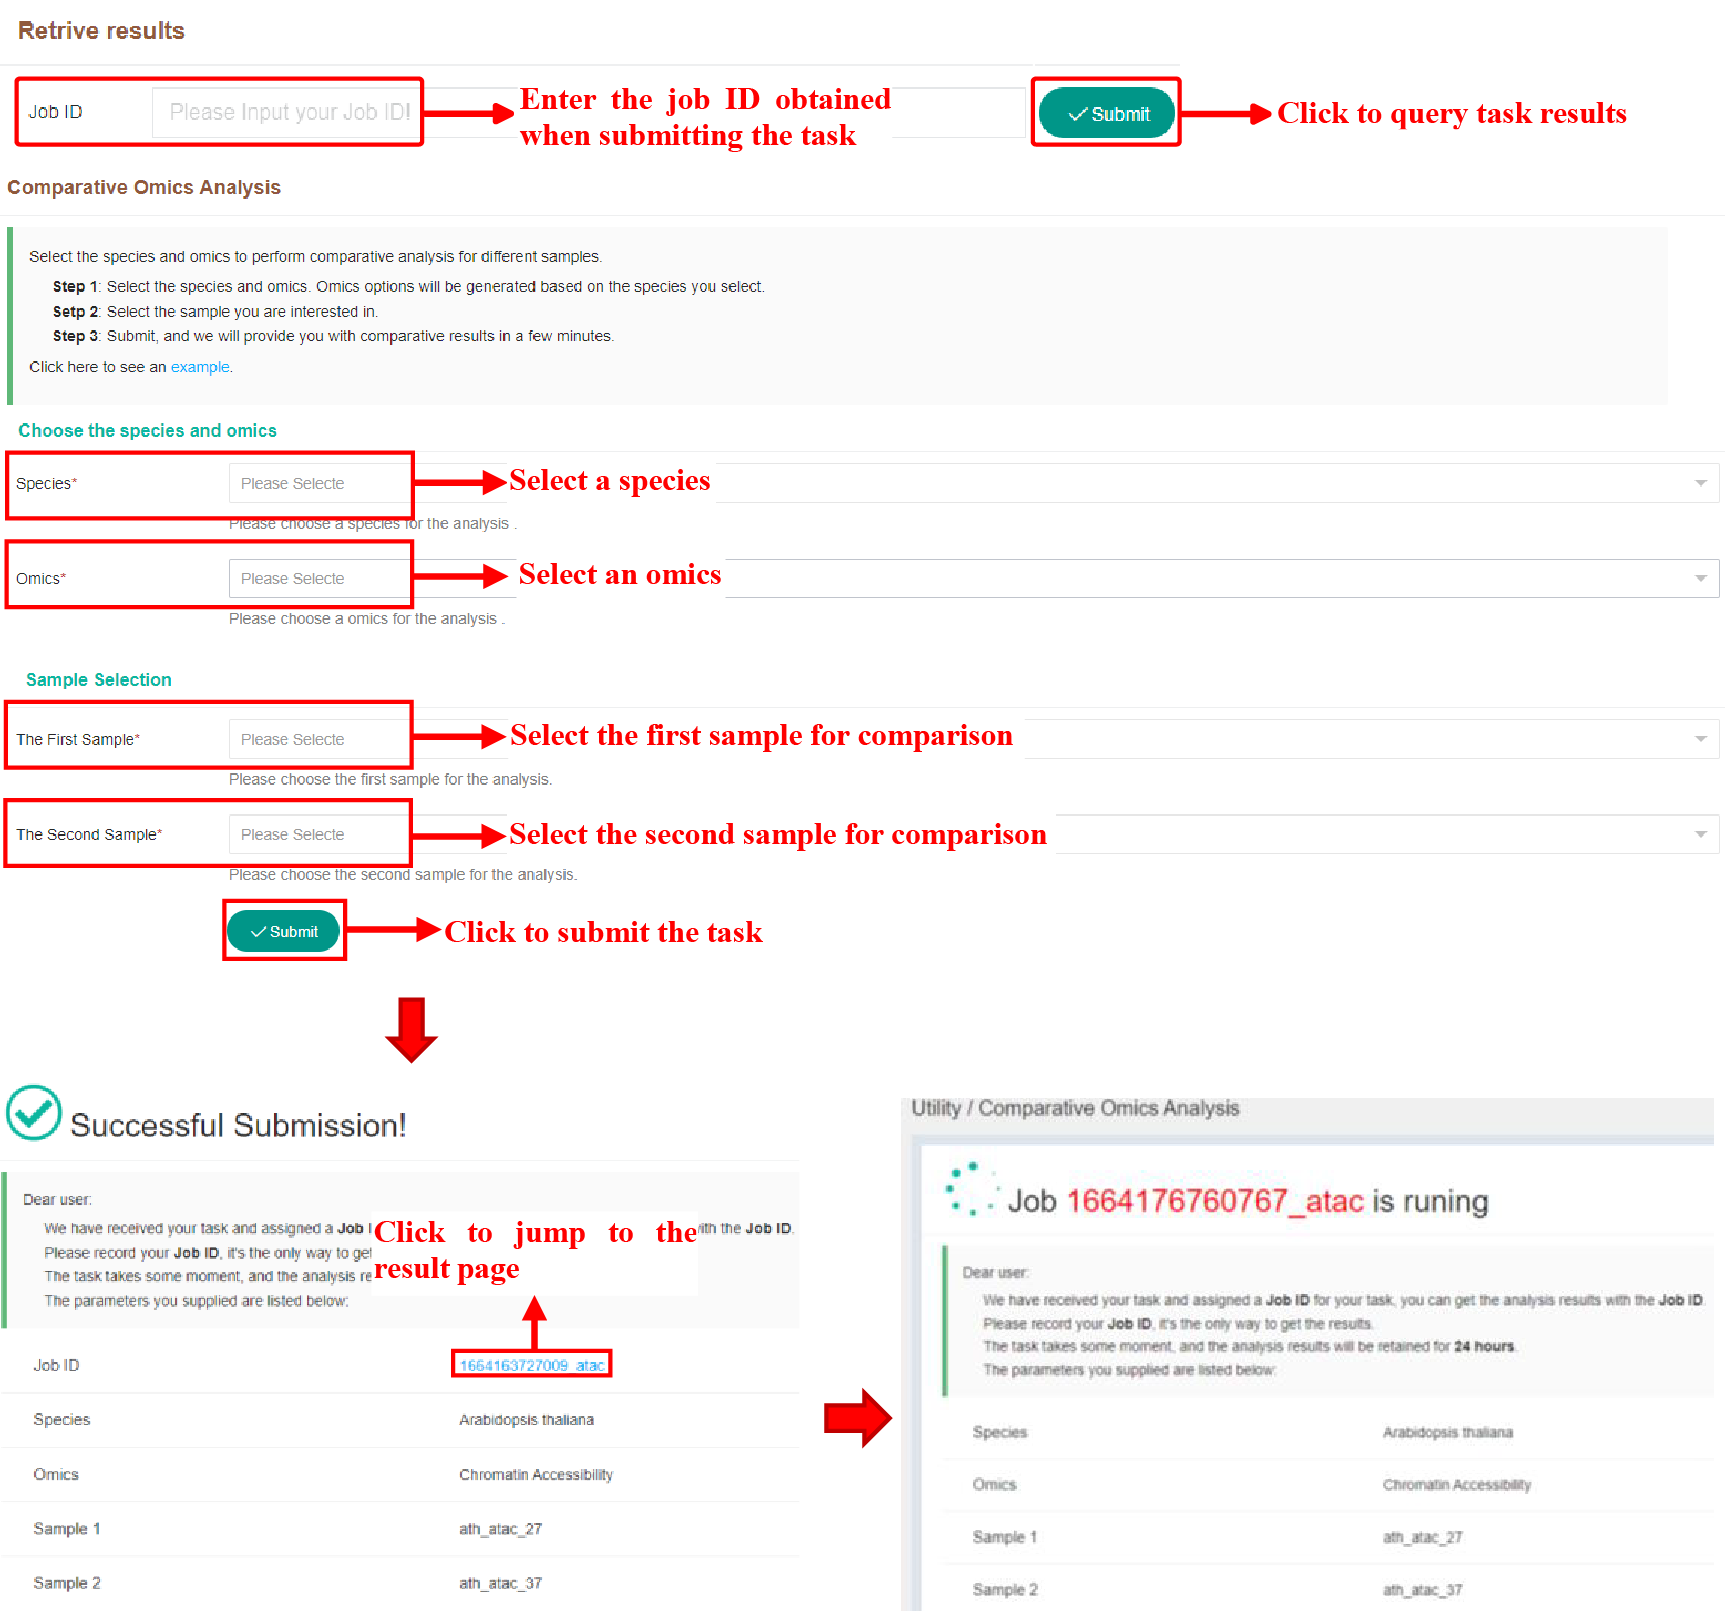
Figure 33 Submission of Omics Comparison Analysis Tool
The above figure shows the way of task submission and result viewing of the comparison tool. On the Submission page, click the jobID to jump to the result page. If the task is not completed, it will wait on the running page, and it will automatically jump after it is completed.
5.1.2 Result Page
5.1.2.1 Chromatin Accessibility
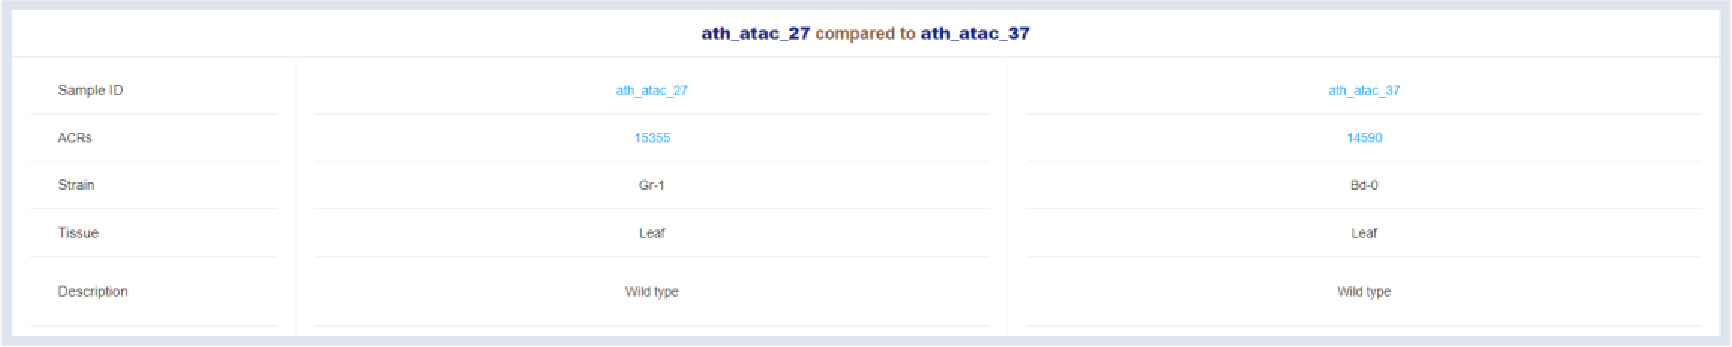
Figure 34 Sample information
Detail informaion of two compared samples is listed here.
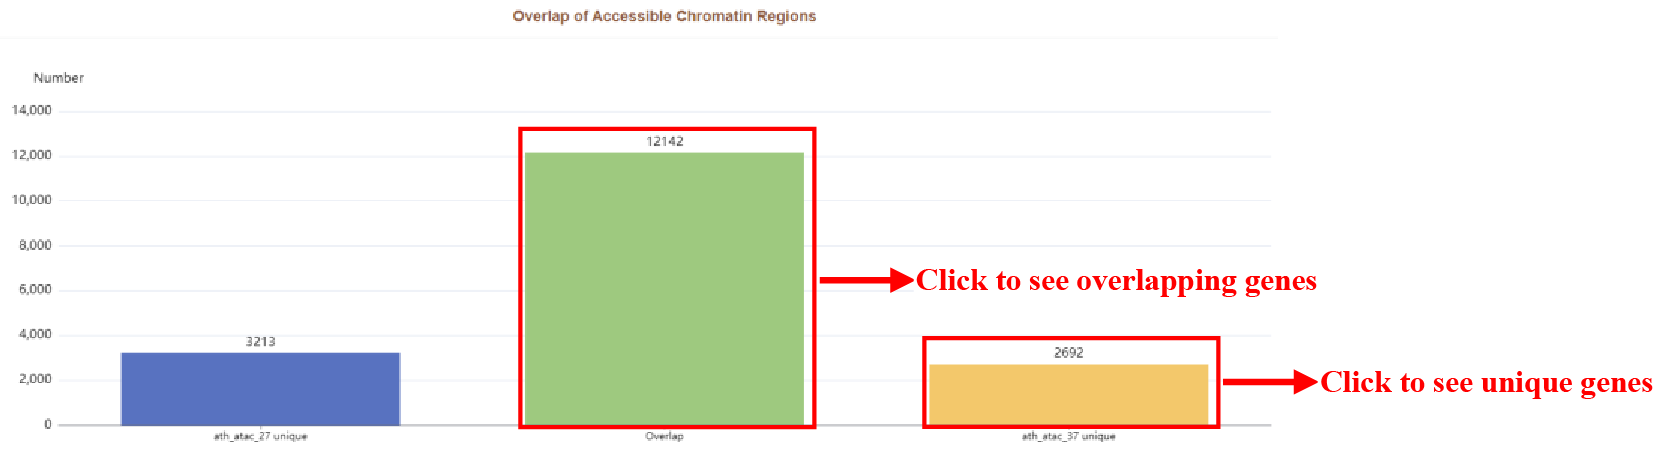
Figure 35 Overlap of accessible chromatin regions
Overlap of Accessible Chromatin Regions plot. The green bar indicates overlapping genes of two samples, the blue bar and the yellow bar indicates unique genes of two sample respectively.
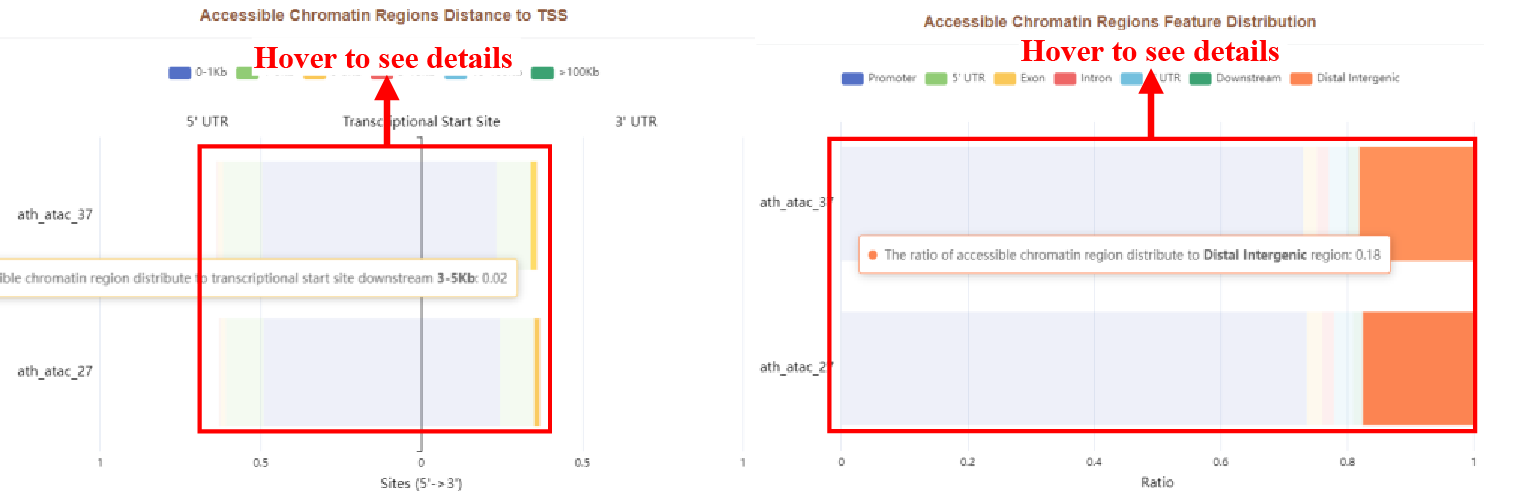
Figure 36 Distribution of accessible chromatin regions
The results page displays the accessible chromatin regions with different distances from the TSS in the form of a bar plot and the accessible chromatin regions feature distribution.
5.1.2.2 Histone Modification
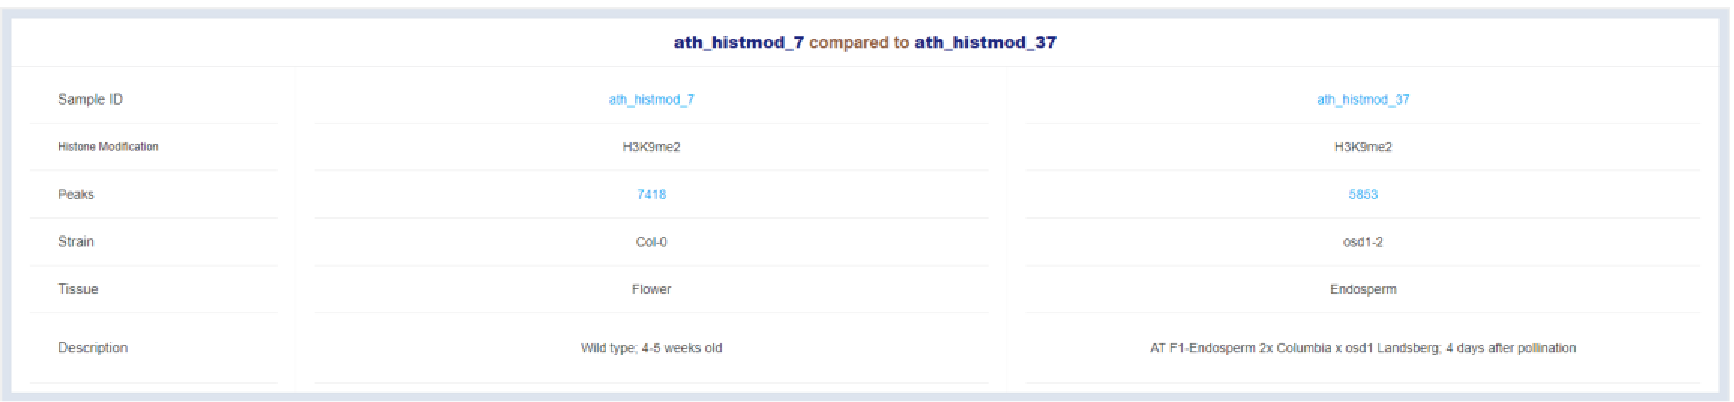
Figure 37 Sample information
Detail informaion of two compared samples is listed here.
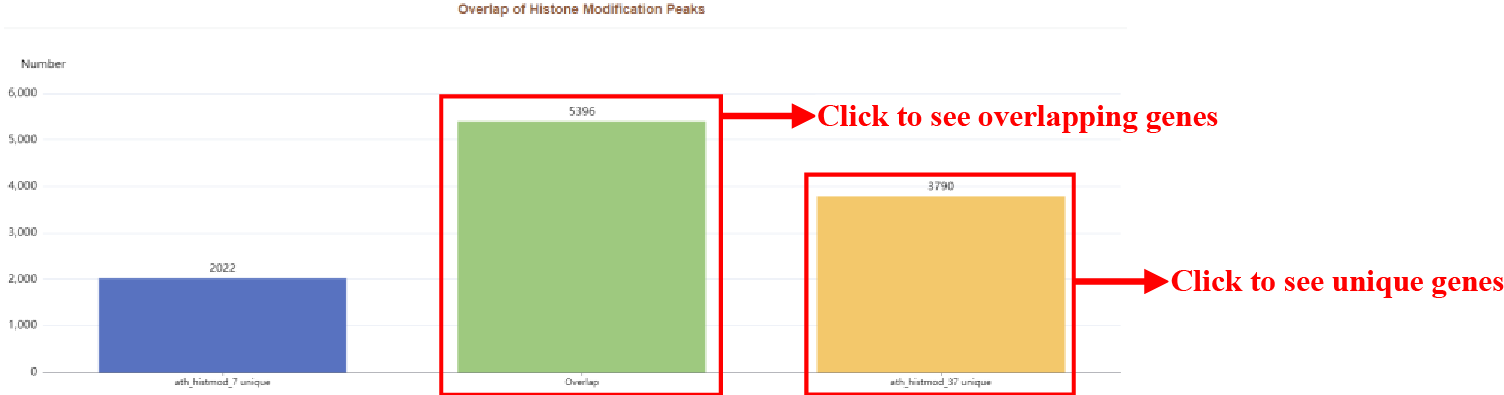
Figure 38 Overlap of histone modification peaks
Overlap of Accessible Chromatin Regions plot. The green bar indicates overlapping genes of two samples, the blue bar and the yellow bar indicates unique genes of two sample respectively.
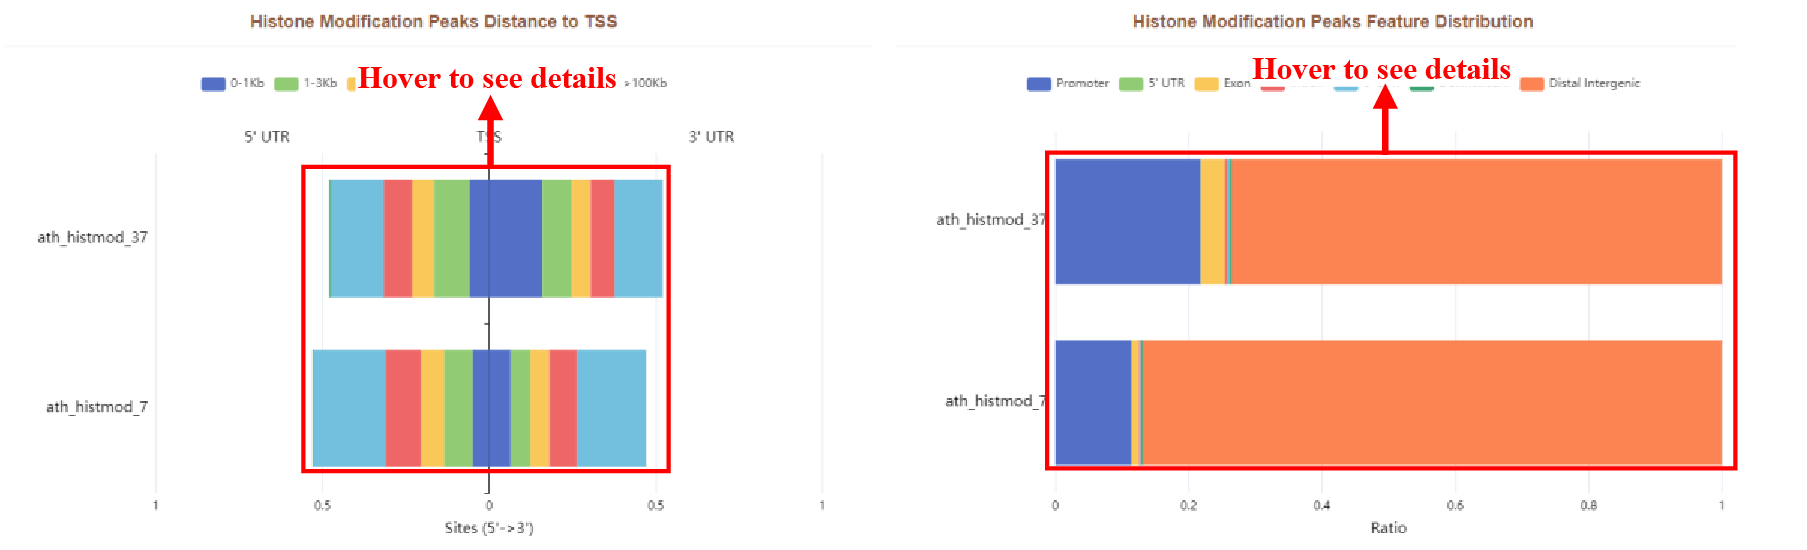
Figure 39 Distribution of histone modification peaks
The results page displays the histone modification peaks with different distances from the TSS and the histone modification peaks feature distribution in the form of bar plots.
5.1.2.3 RNA m6A Modification
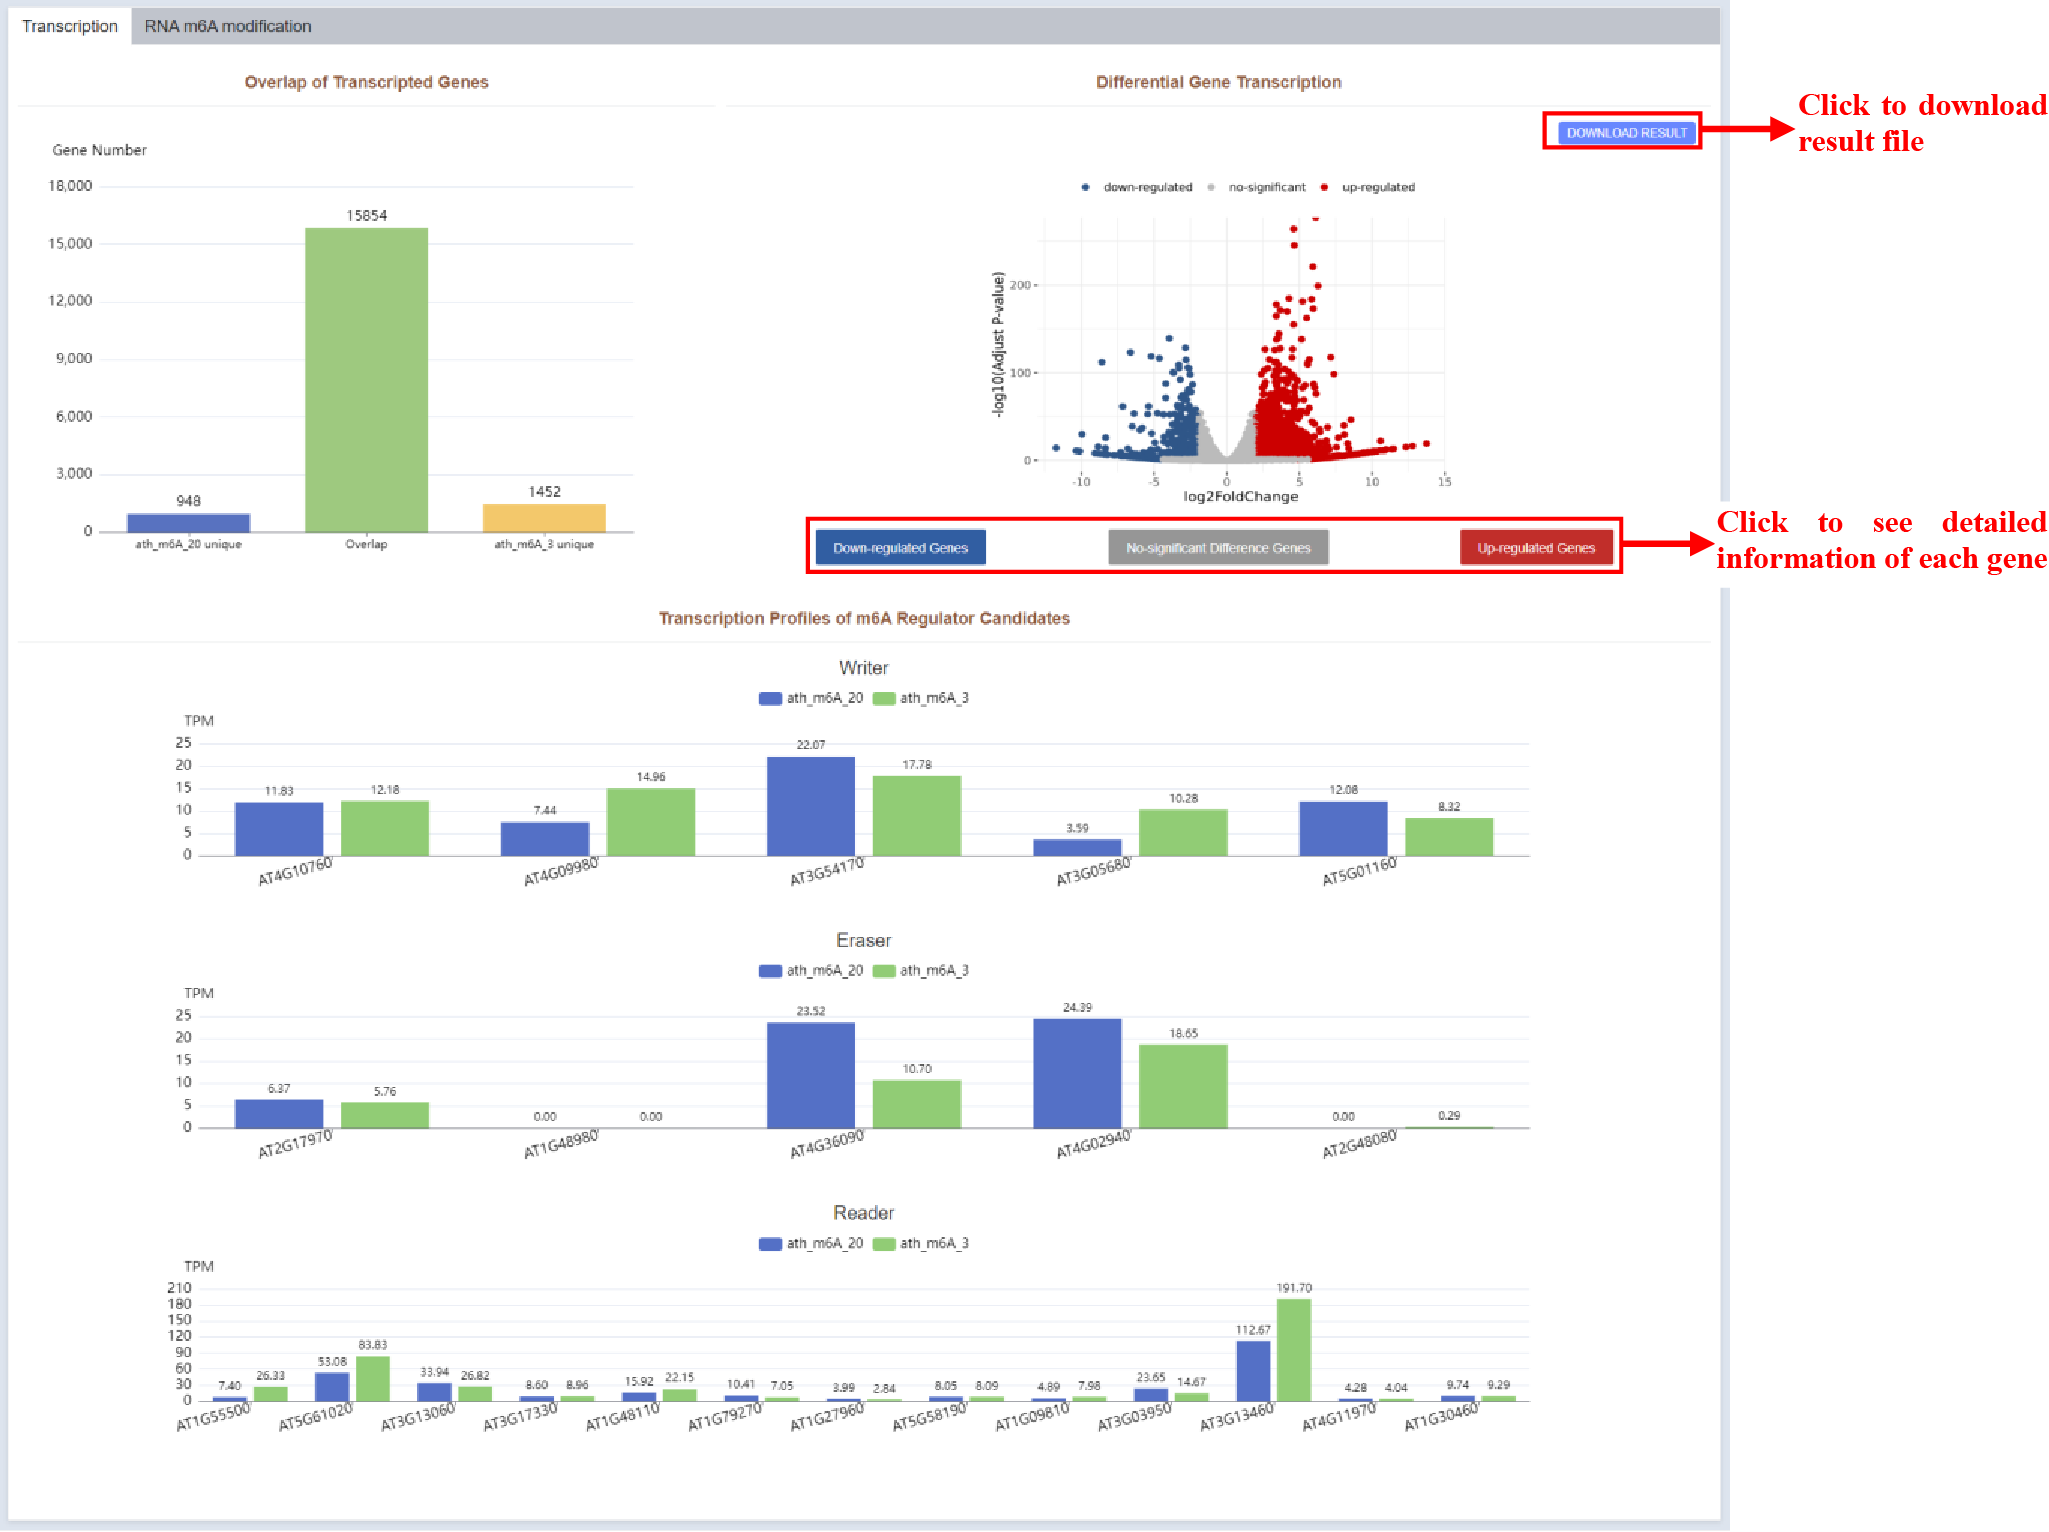
Figure 40 Transcription profiles of compared m6A-seq samples
As is shown in figure 11, the transcription part of RNA m6A modification results page draws a volcano plot showing genes with significantly different expression levels. The expression of m6a-regulated candidate genes in the two samples is displayed in the form of a bar plot.
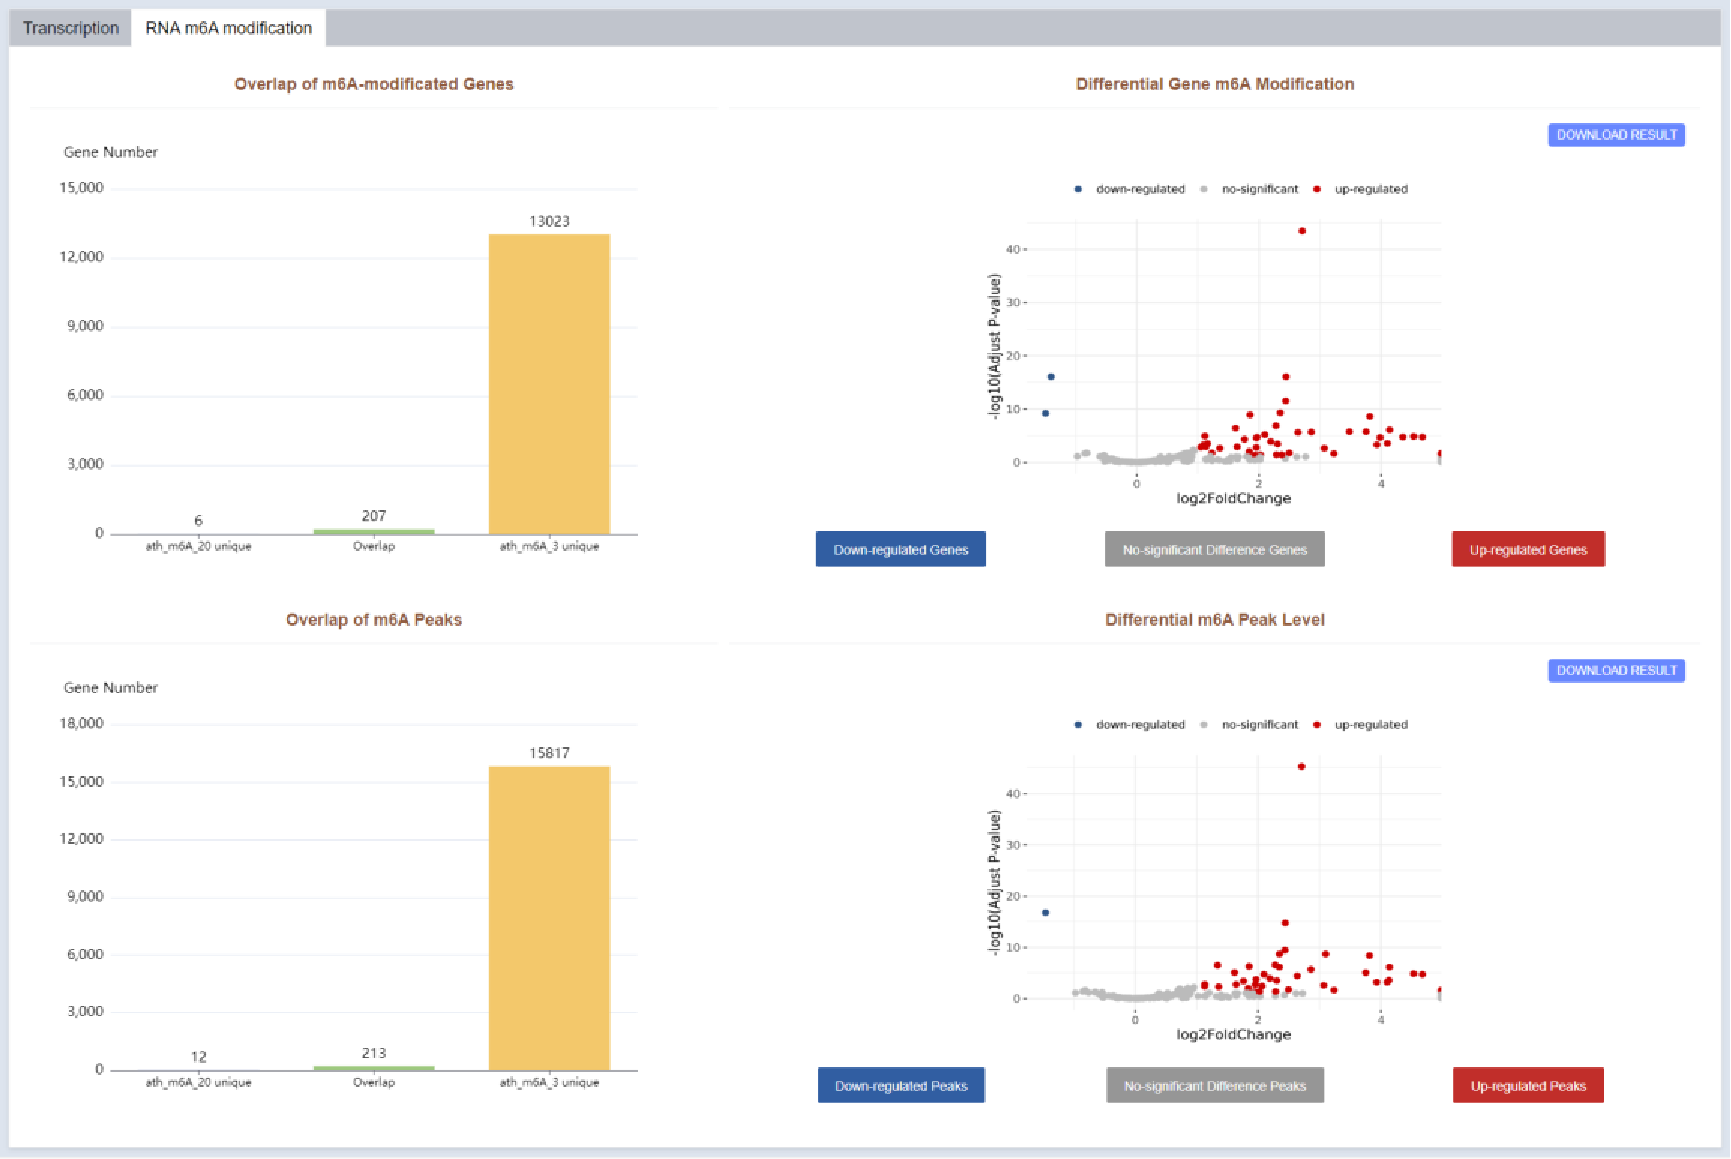
Figure 41 RNA m6A modification profiles of compared m6A-seq samples
In the modification part, the gene and peak differences of the two samples were analyzed separately, and the difference and overlapping modified genes and peaks were displayed in the form of bar plots; and the volcano plot was drawn to show the genes with significant m6a modification differences and the peaks with significant differences.
5.1.2.4 DNA Methylation
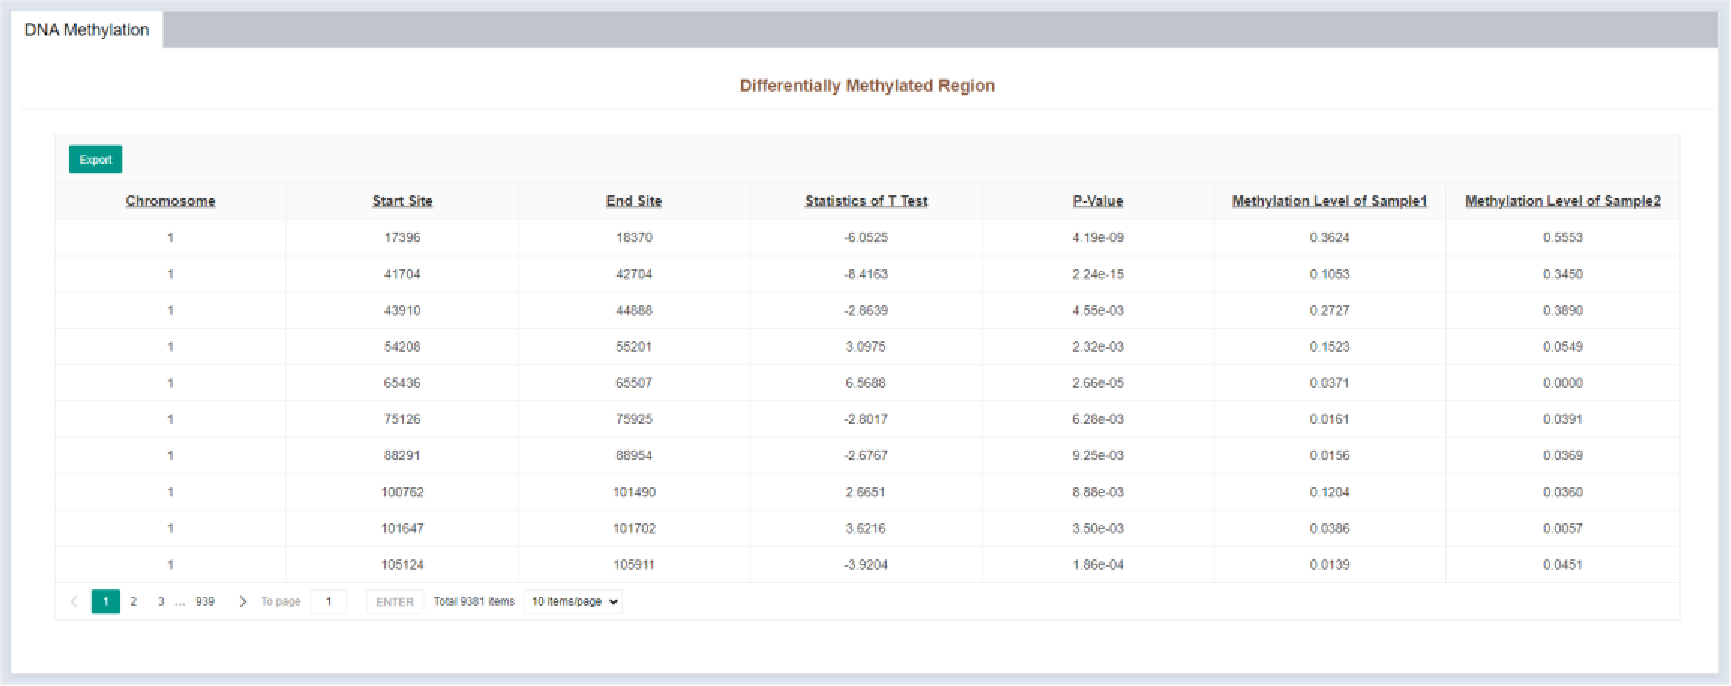
Figure 42 Differentially methylated region
The DNA methylation results page displays the differentially methylated regions in tabular form. The table details are as follows:
| Columns | Details |
|---|---|
| Chromosome | Chromosome of differentially methylated region |
| Start Site | Leftmost position of differential methylation region |
| End Site | Rightmost position of differential methylation region |
| Statistics of T Test | Statistics of T test |
| P-Value | P-value of T test |
| Methtylation Level of Sample 1 | Methylation level of differential methylation region in sample 1 |
| Methtylation Level of Sample 2 | Methylation level of differential methylation region in sample 2 |
5.1.2.5 Transcriptome
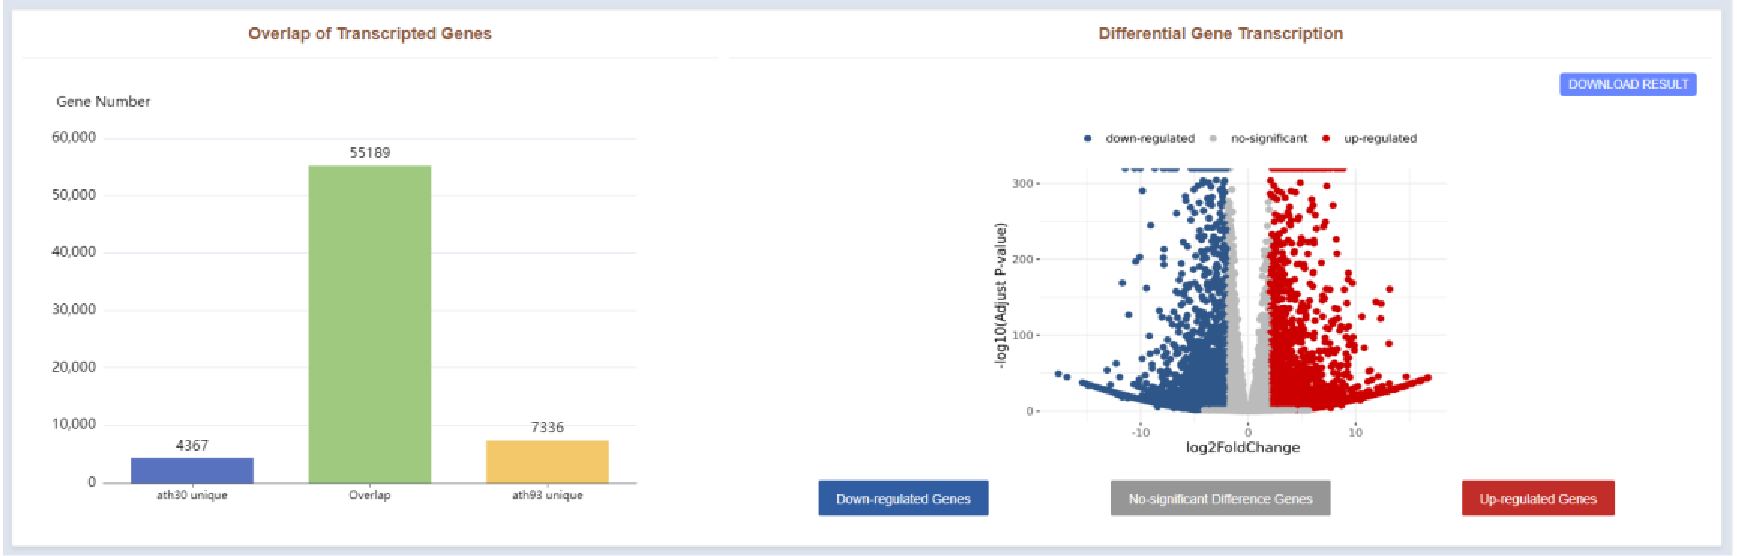
Figure 43 Transcription profiles of compared RNA-seq samples
The Transcriptome Results page displays different and overlapping genes between the two samples in a bar plot, and a volcano plot showing genes with significantly different expression.
5.2 Multi-omics Integration Analysis Utility
5.2.1 Submit Tasks
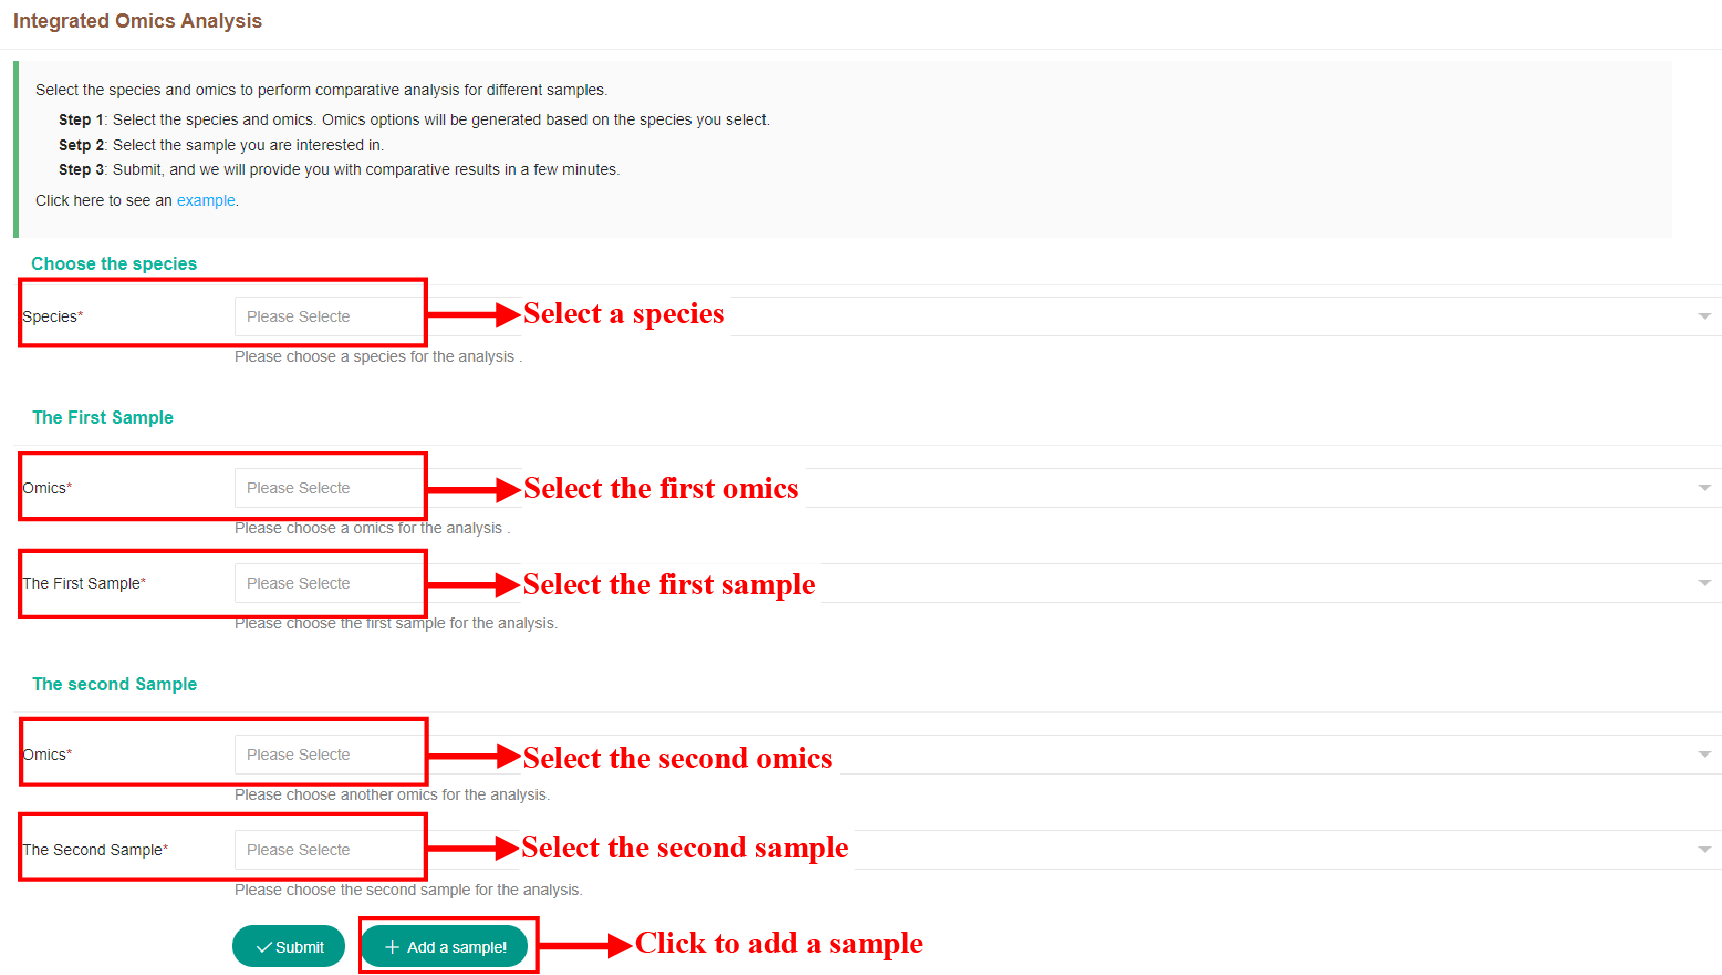
Figure 44 Submission of Integrated Omics Analysis Tool
The figure above shows how to submit tasks for integration tools, which can integrate up to three omics.
5.2.2 Result Page
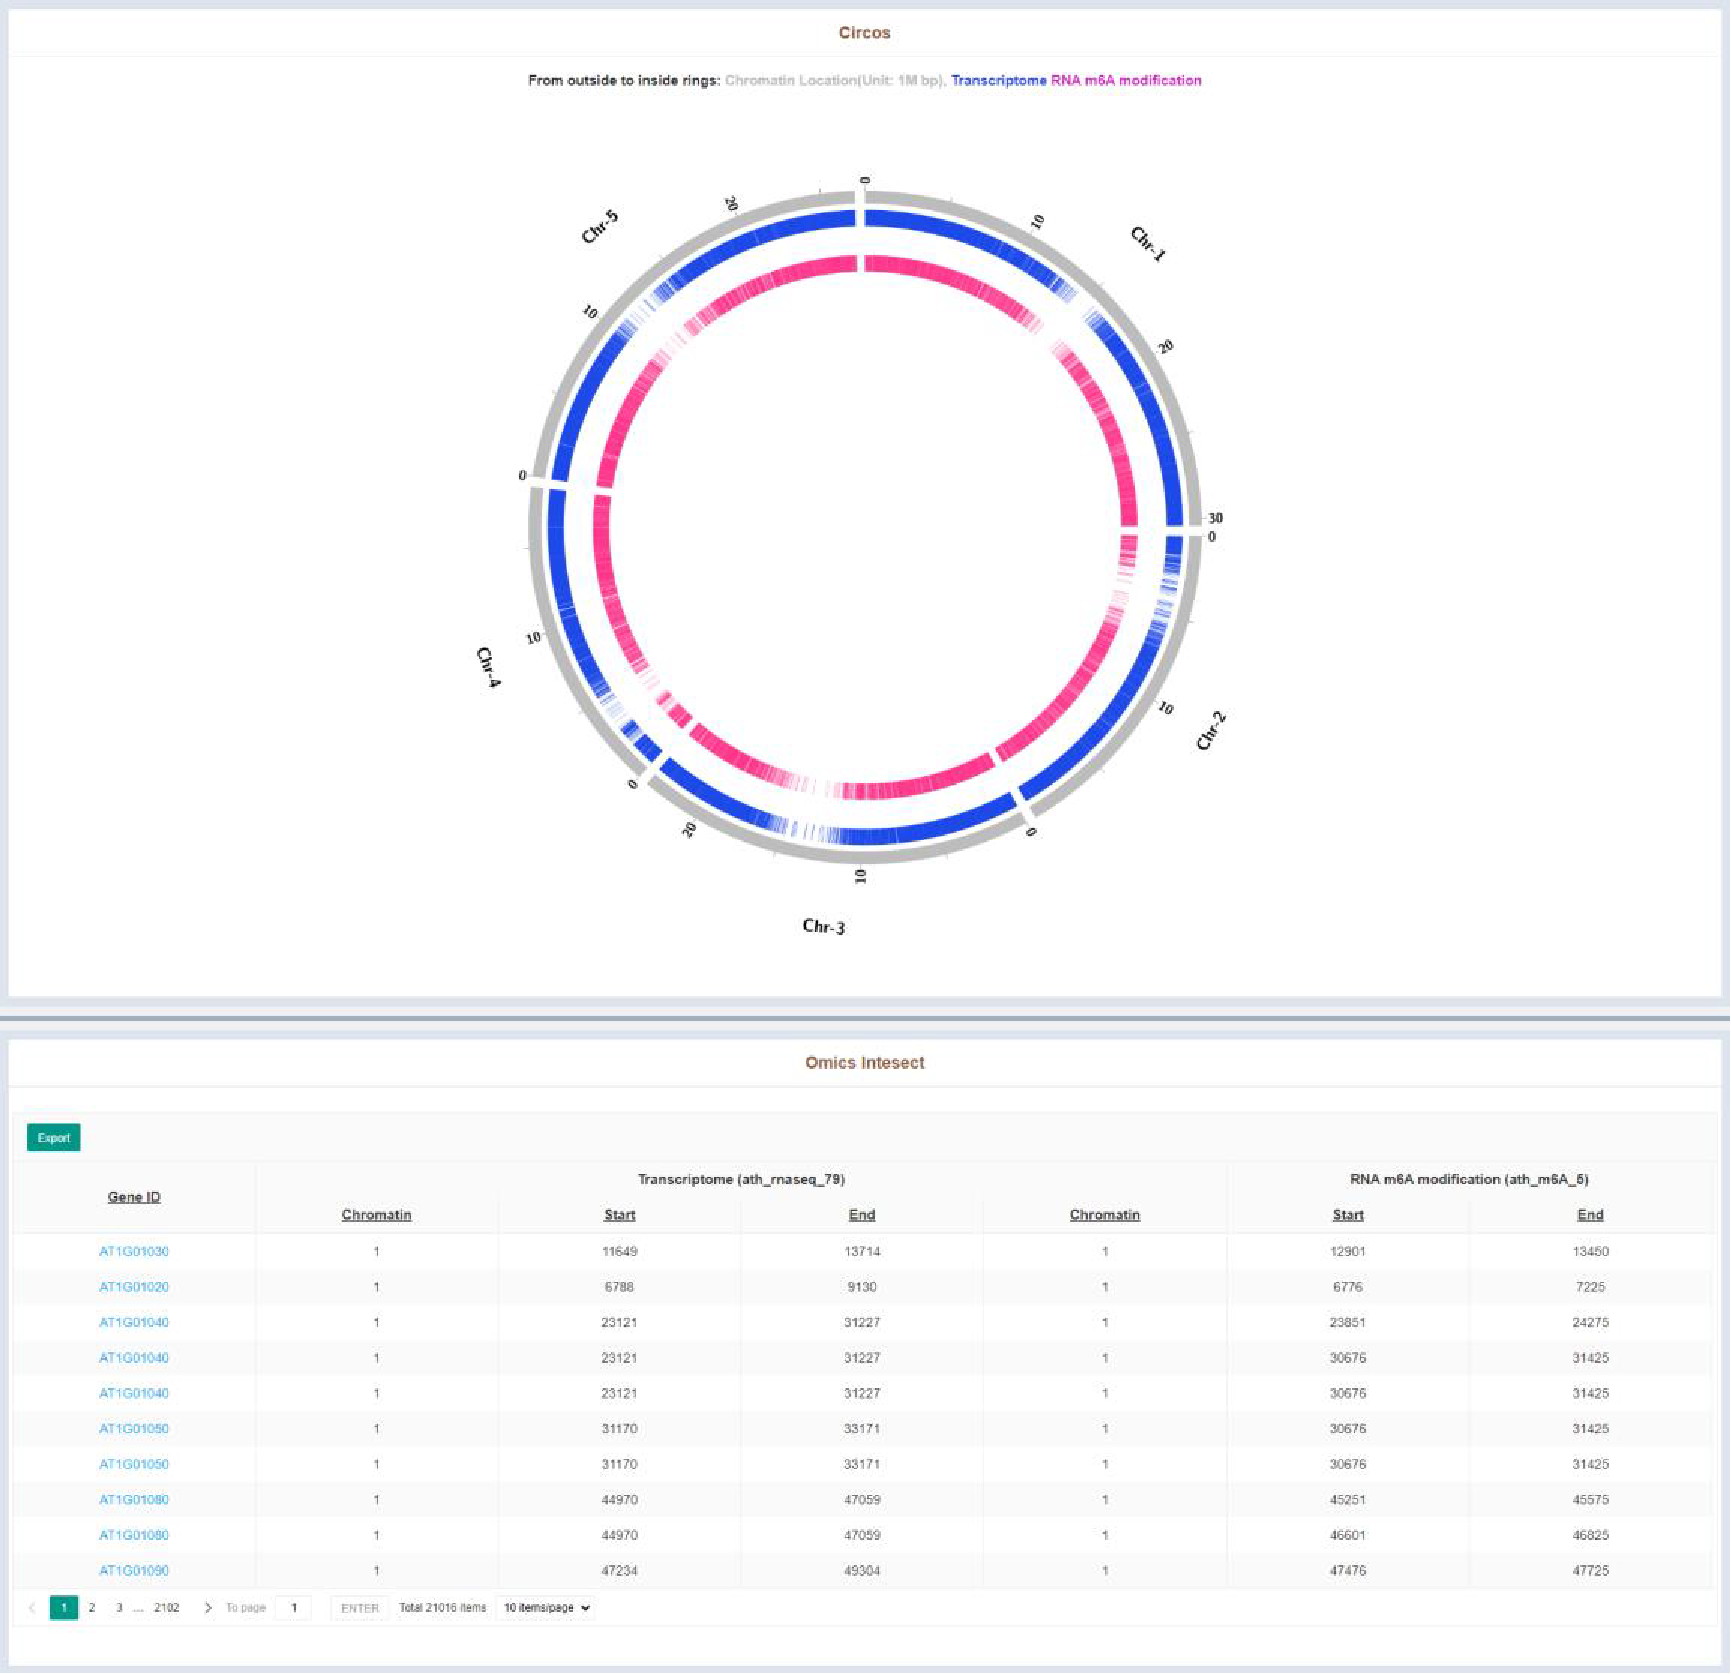
Figure 45 Result of Multi-omics Integration Analysis tool
The integration tool results page lists the intersection of two omics significant regions in tabular form and visualized with a circos plot. The table details are as follows:
| Columns | Details |
|---|---|
| Chromosome (1) | Chromatin of intersect peak in sample 1 |
| Start (1) | Leftmost position of intersect peak in sample 1 |
| End (1) | Rightmost position of intersect peak in sample 1 |
| Chromosome (2) | Chromatin of intersect peak in sample 2 |
| Start (2) | Leftmost position of intersect peak in sample 2 |
| End (2) | Rightmost position of intersect peak in sample 2 |
5.3 Evolutionary Information Annotation Utility
5.3.1 Submit Tasks
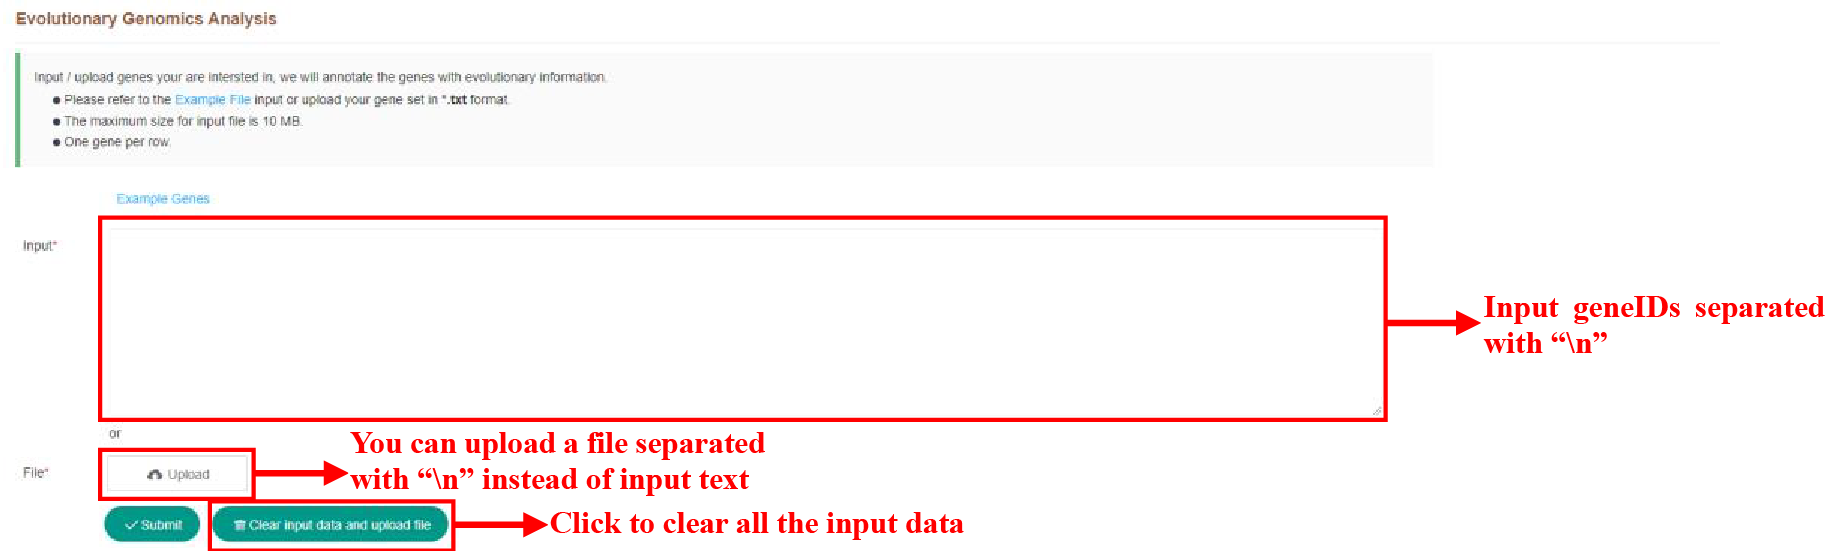
Figure 46 Submission of Evolutionary Information Analysis Tool
The figure above shows how the evolutionary analysis tool is used. You can enter text or upload a file to submit genes to search.
5.3.2 Result Page
5.3.2.1 Genes Evolutionary Annotation
The Evolutionary Information Annotation Tool result page presents evolutionary information for the searched genes in various formats.
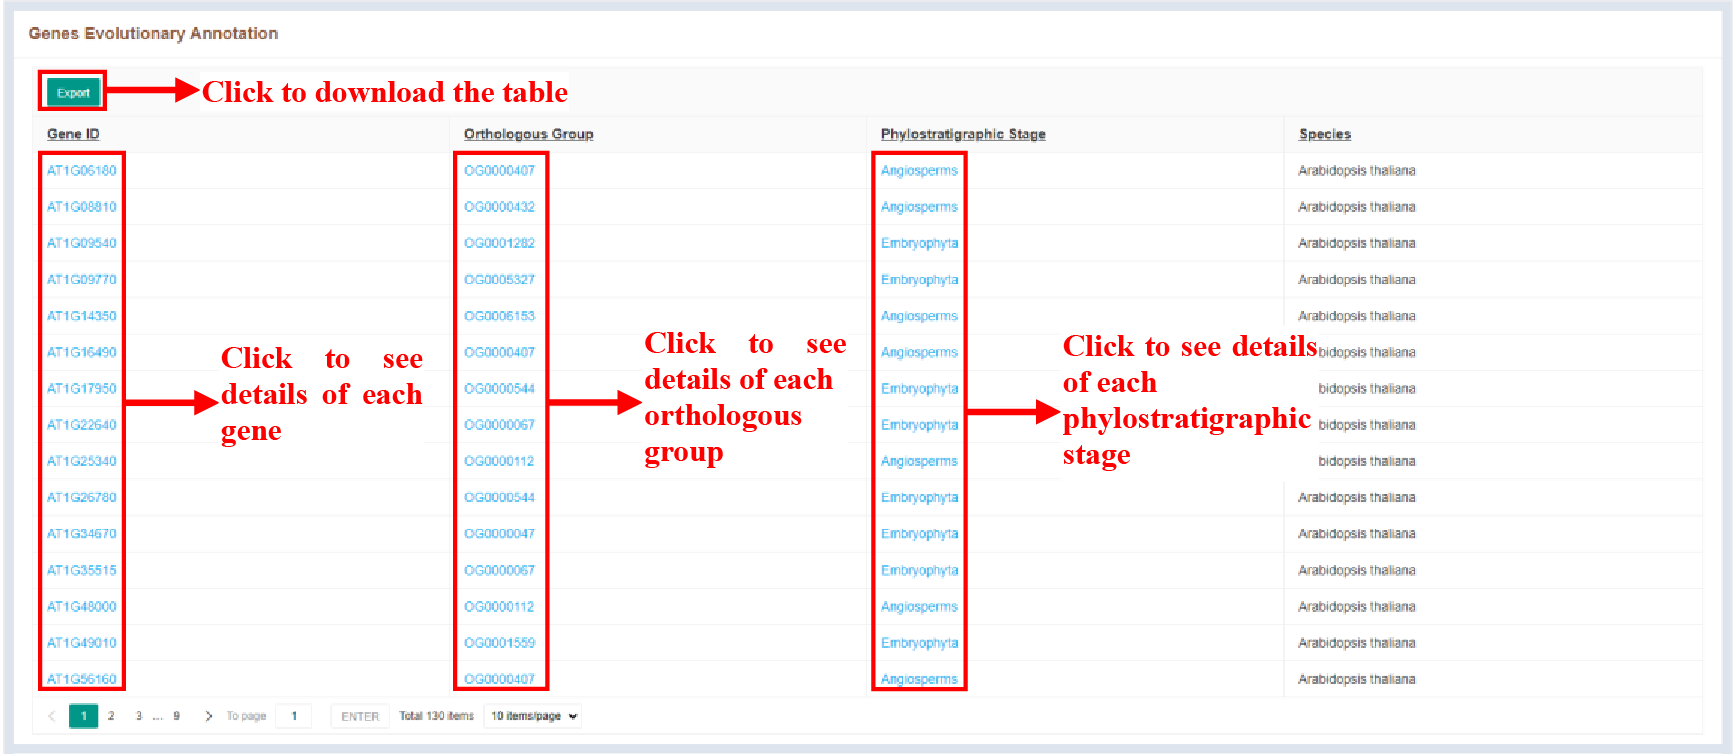
Figure 47 Genes evolutionary annotation
The orthologous groups and phylostratigraphic stages associated with each gene are displayed in tabular form. The table details are as follows:
| Columns | Details |
|---|---|
| Gene ID | Queried gene ID |
| Orthologous Group | Orthologous group of queried gene |
| Phylostratigraphic stage | Phylostratigraphic stage of the orthologous group to which the queried gene belongs |
| Species | Species of queried gene |
5.3.2.2 Phylostratigraphic Tree
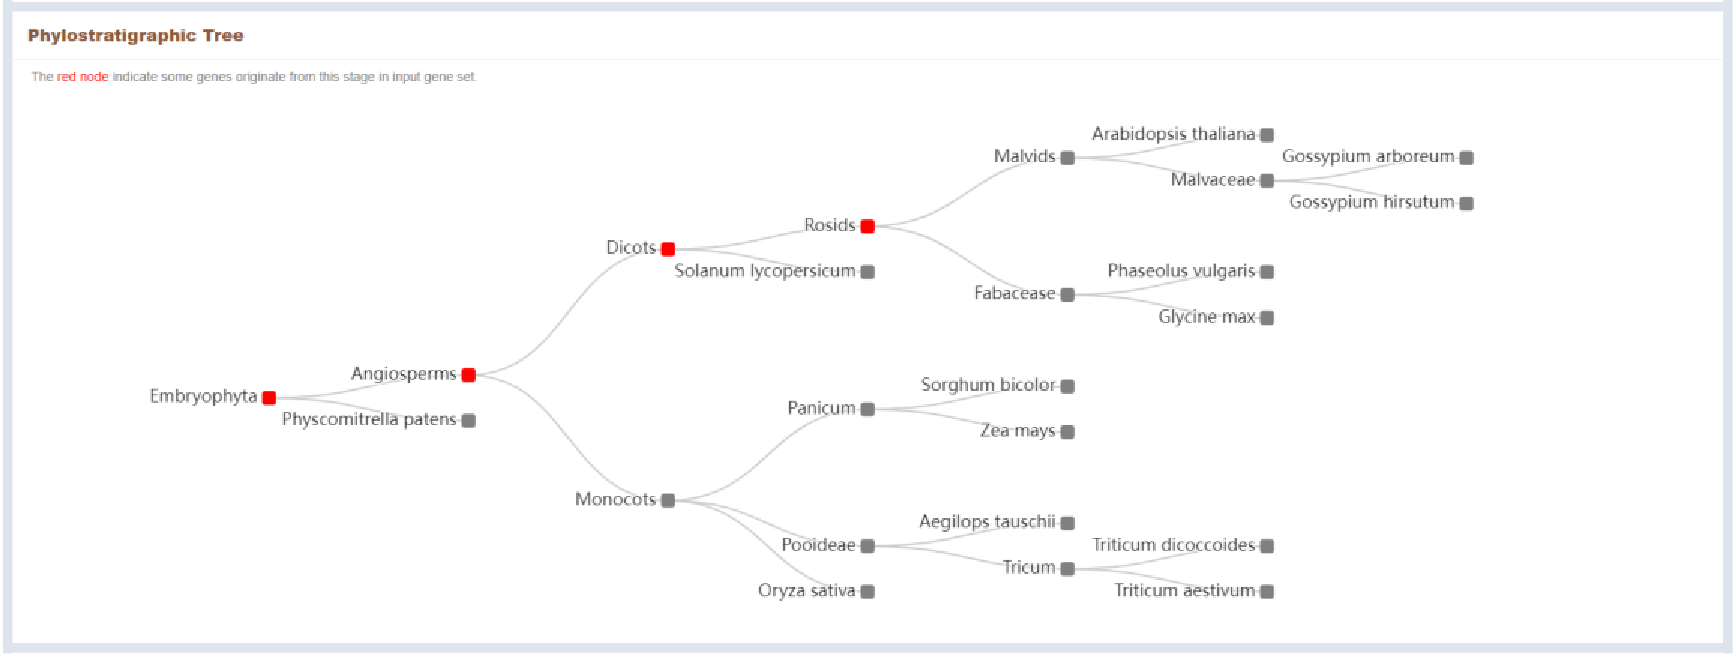
Figure 48 Genes Phylostratigraphic tree
The phylostratigraphic stages involved in the genes entered by the user are marked in red in the phylostratigraphic tree.
5.3.2.3 Genes Evolutionary Origin
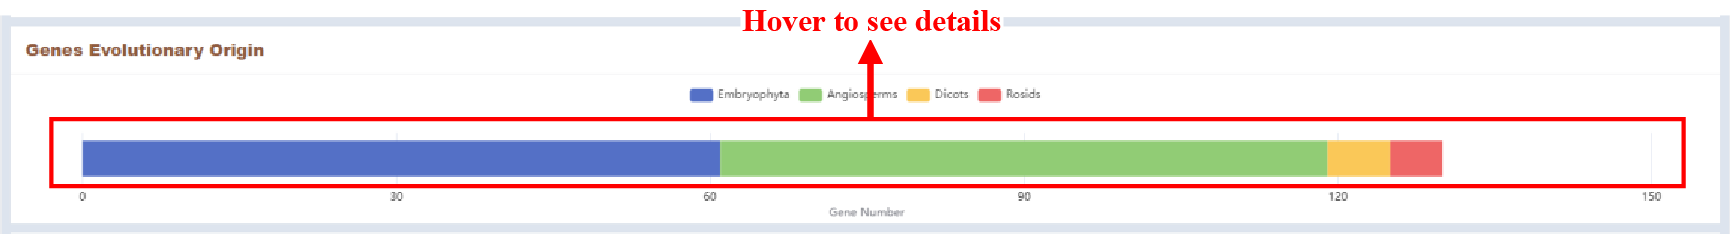
Figure 49 Genes evolutionary origin
The number of genes at different phylostratigraphic stages is displayed in the form of a bar plot.
5.3.2.4 Gene Related Orthologous Groups
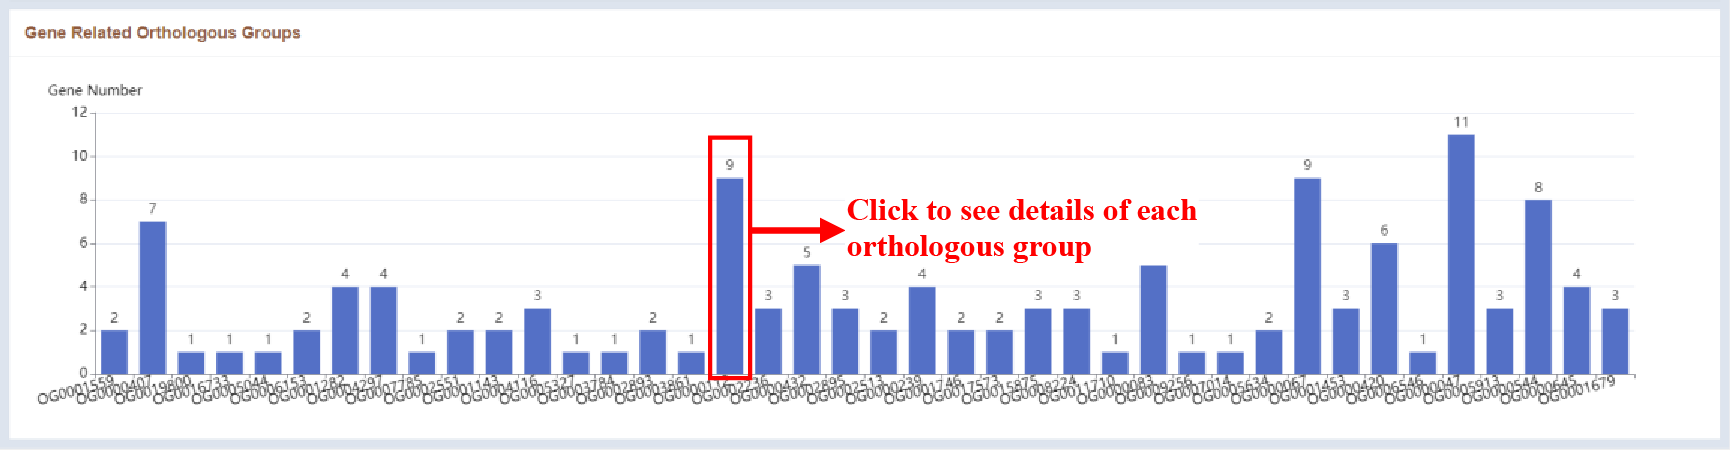
Figure 50 Gene related orthologous groups
The number of genes associated with different orthologous groups is displayed as a bar plot.
5.3.2.5 Duplication Events
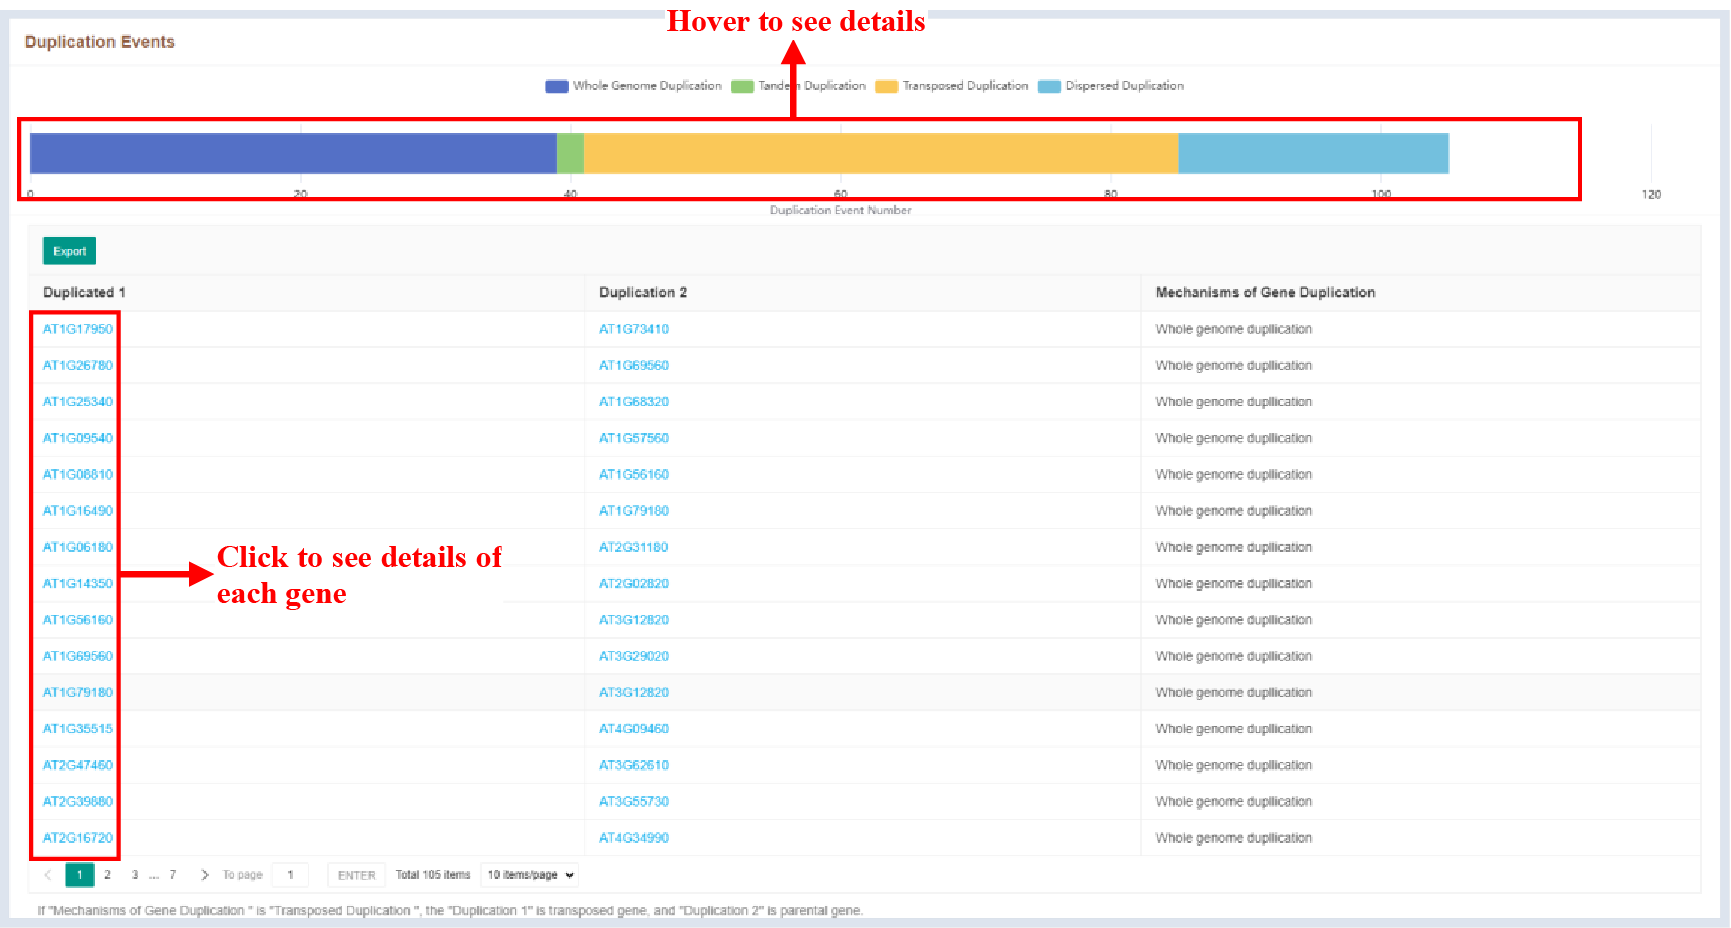
Figure 51 Duplication events
The bar plot shows the number of genes with different duplication event mechanisms, and the table shows the repeat mechanism of each duplicate gene pair.
5.4 Transcriptome-wide Association Analysis Utility
5.4.1 Submit Tasks
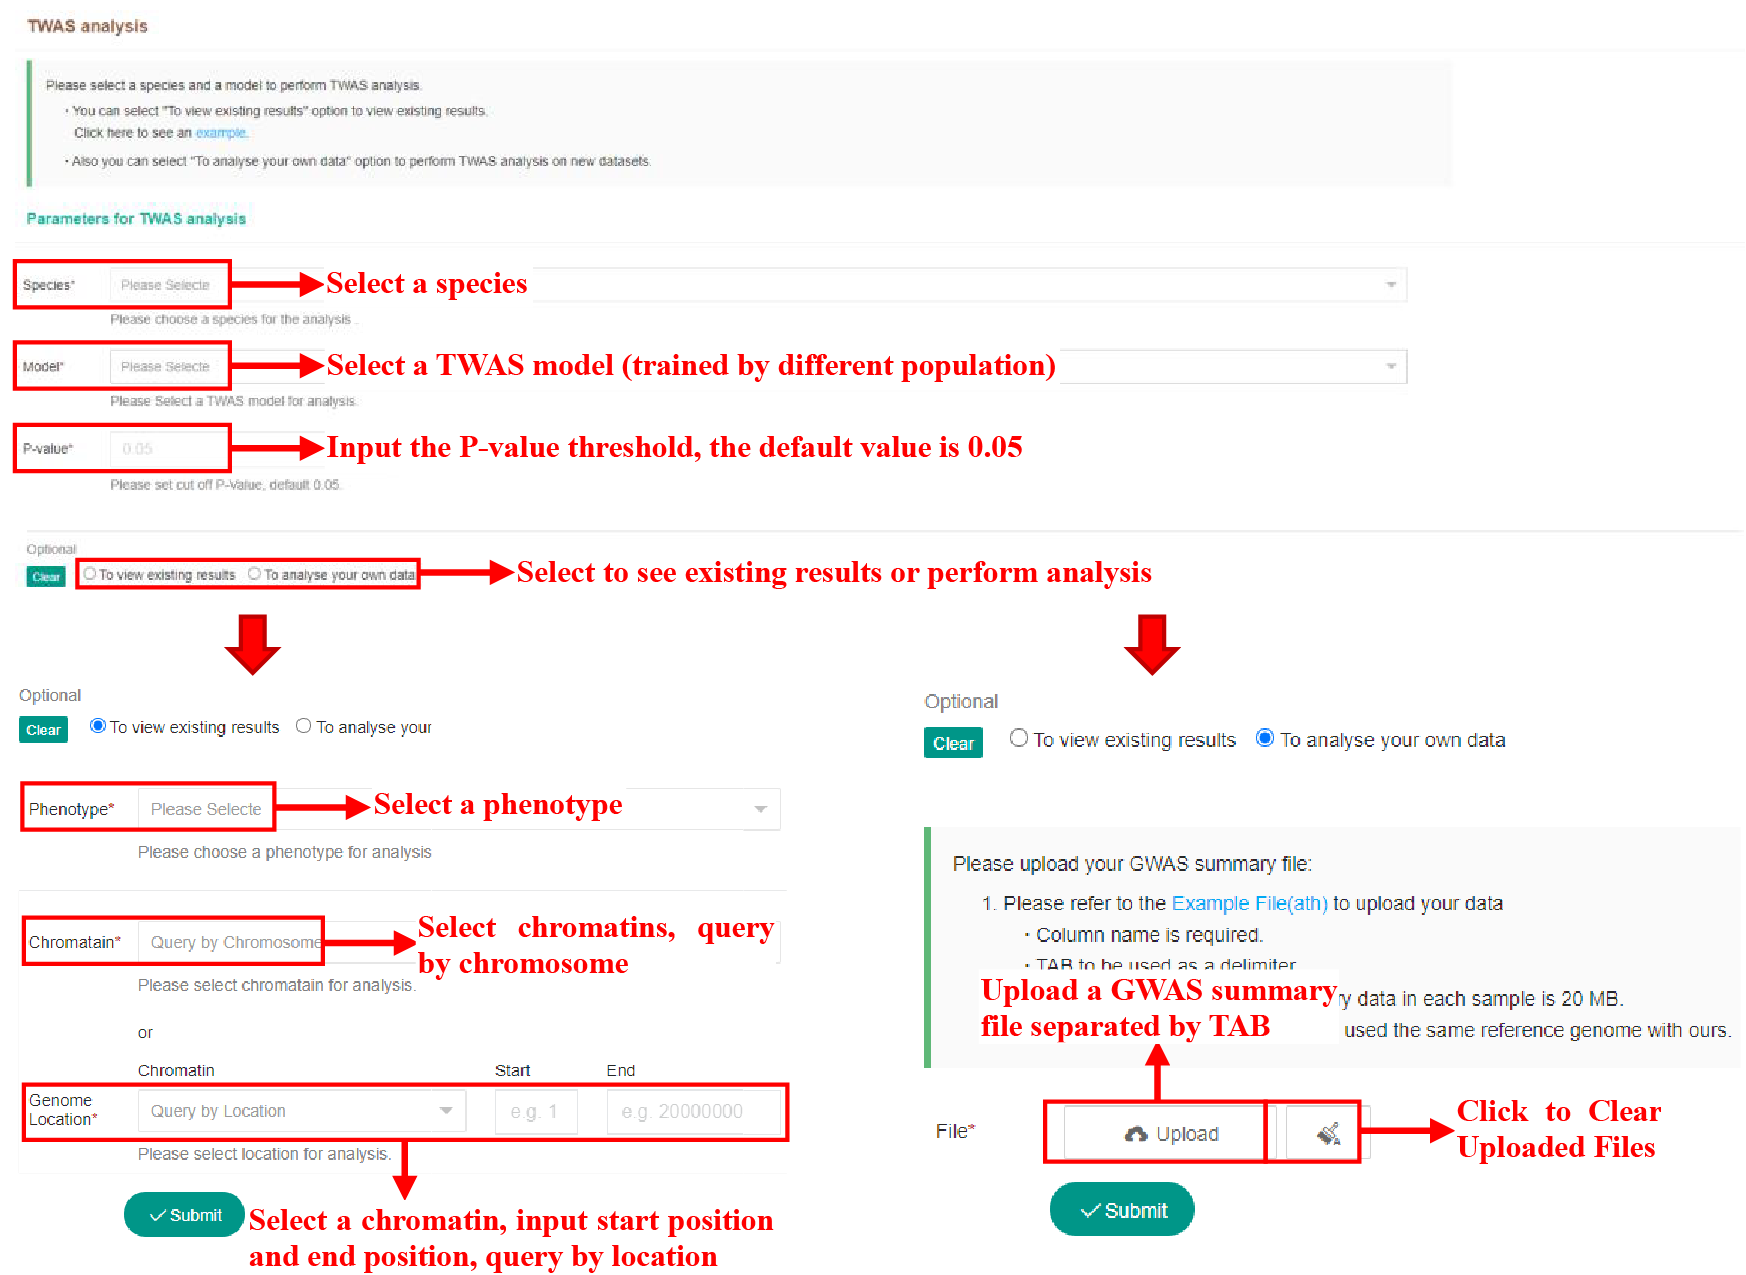
Figure 52 Submission of Transcriptome-wide Association Analysis Tool
The above figure shows the usage of the twas analysis tool. Users can view the existing TWAS results in the database or analyze their own data. The content and usage of the Submission page is the same as the omics comparison analysis tool.
5.4.2 Result Page
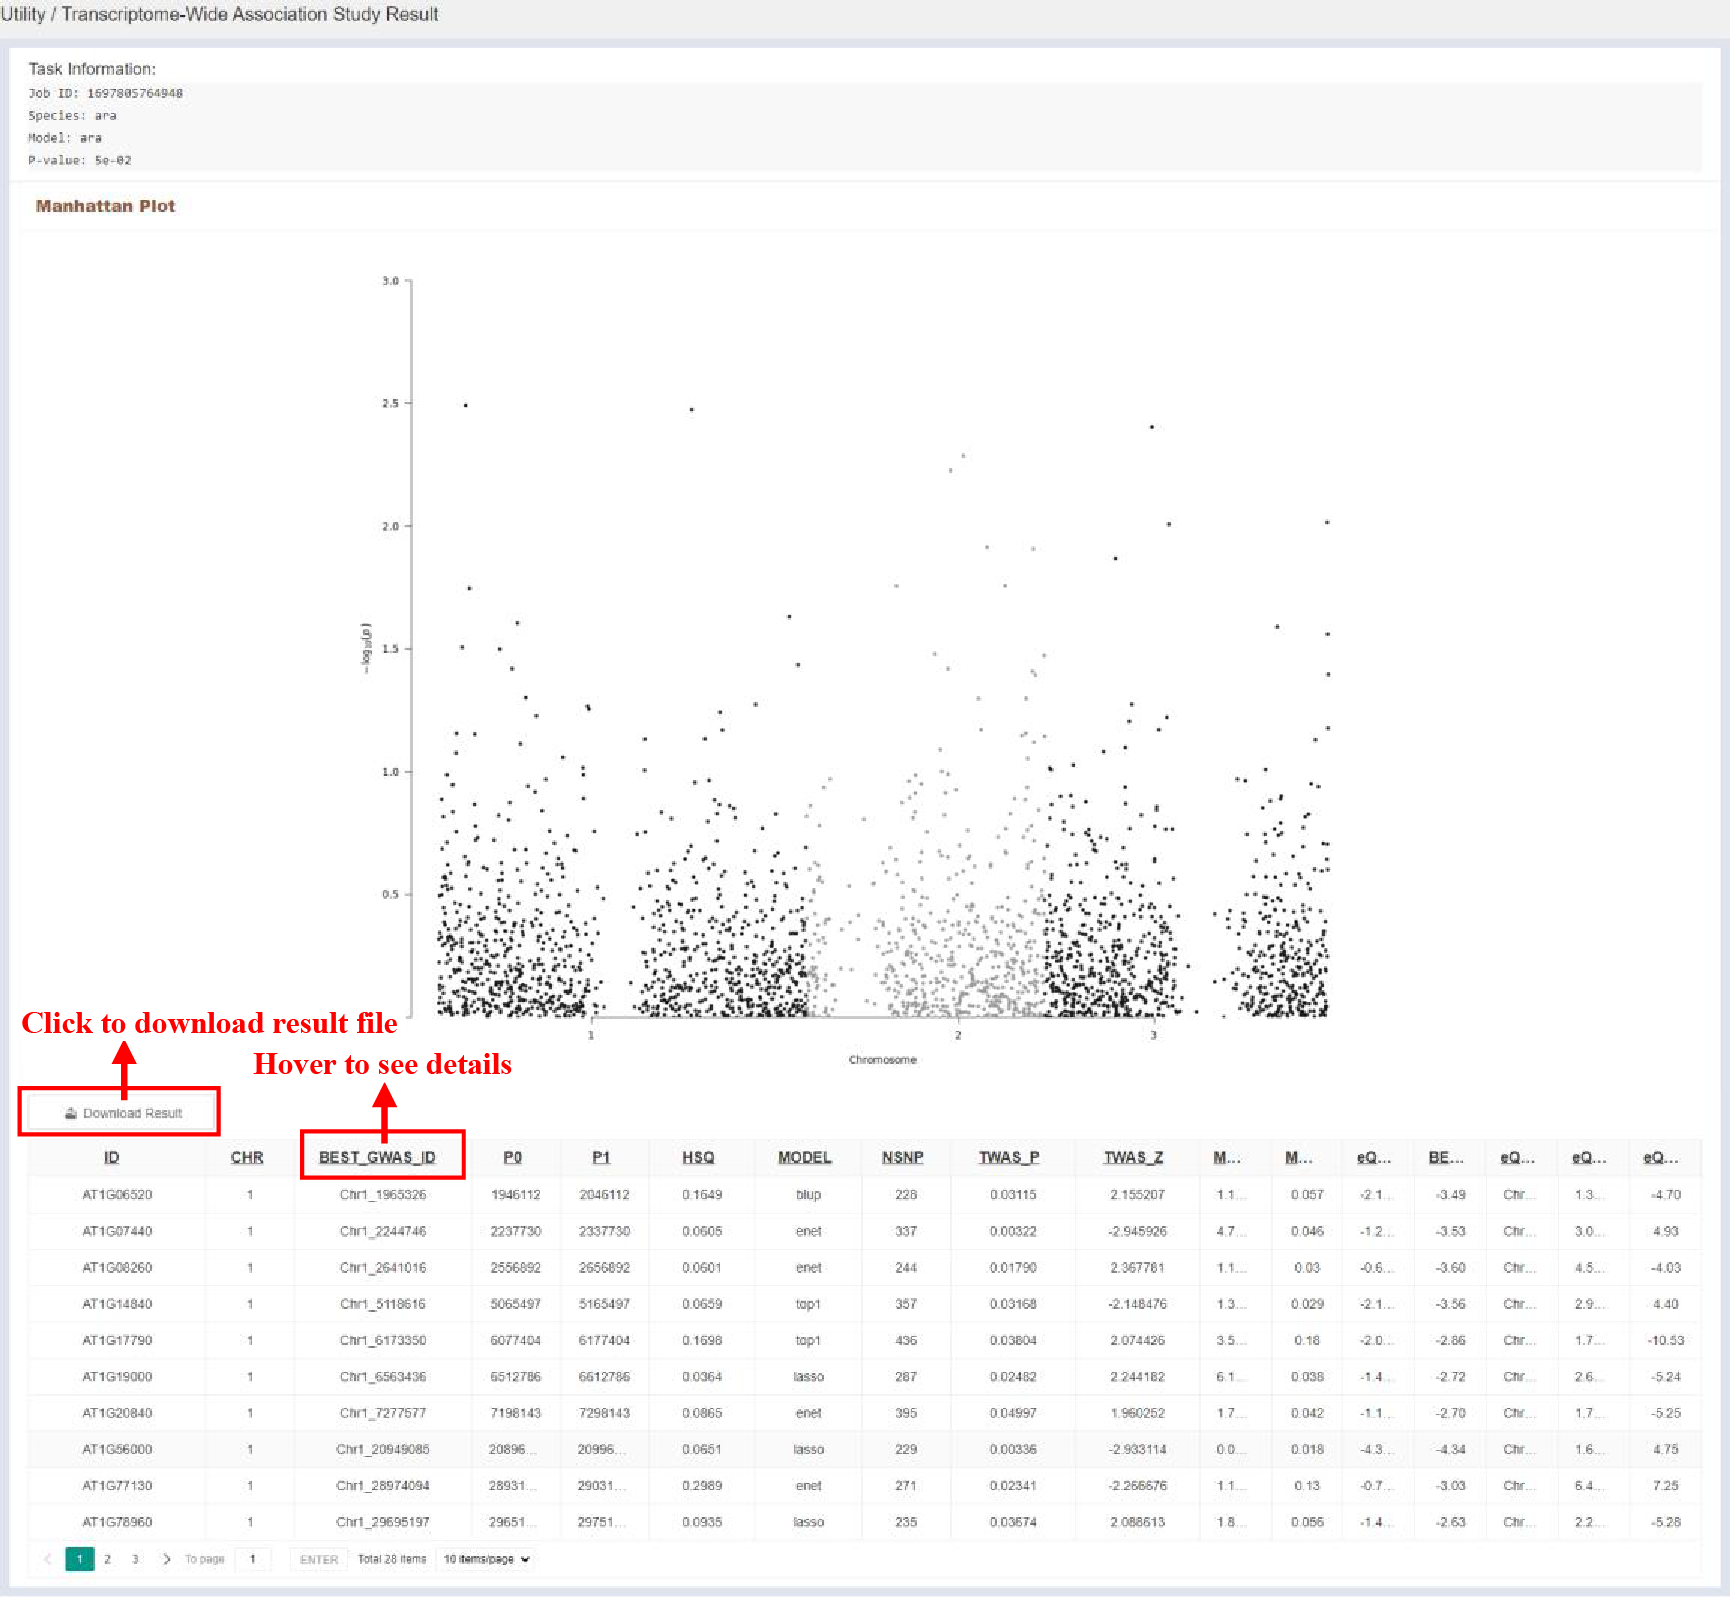
Figure 53 Result of Transcriptome-wide Association Analysis Tool
The TWAS results are visualized in the form of a Manhattan map, and details of the TWAS results are given in the table, and the contents of the table are as follows:
| Columns | Details |
|---|---|
| ID | Feature/gene identifier |
| CHR | Chromosome |
| BEST_GWAS_ID | rsID of the most significant GWAS SNP in locus |
| P0 | Gene start |
| P1 | Gene end |
| HSQ | Heritability of the gene |
| MODEL | Best performing model |
| NSNP | Number of SNPs in the locus |
| TWAS_P | TWAS P-value |
| TWAS_Z | TWAS Z-score |
| MODELCV_PV Gene | cross-validation P-value of the best performing model |
| MODELCV_R2 | cross-validation R2 of the best performing model |
| eQTL_GWAS_Z | GWAS Z-score for this eQTL |
| BEST_GWAS_Z | Z-score of the most significant GWAS SNP in locus |
| eQTL_ID | rsID of the best eQTL in the locus |
| eQTL_R2 | cross-validation R2 of the best eQTL in the locus |
| eQTL_Z | Z-score of the best eQTL in the locus |
5.5 Phylogenetic Tree Construction Utility
5.5.1 Submit Tasks
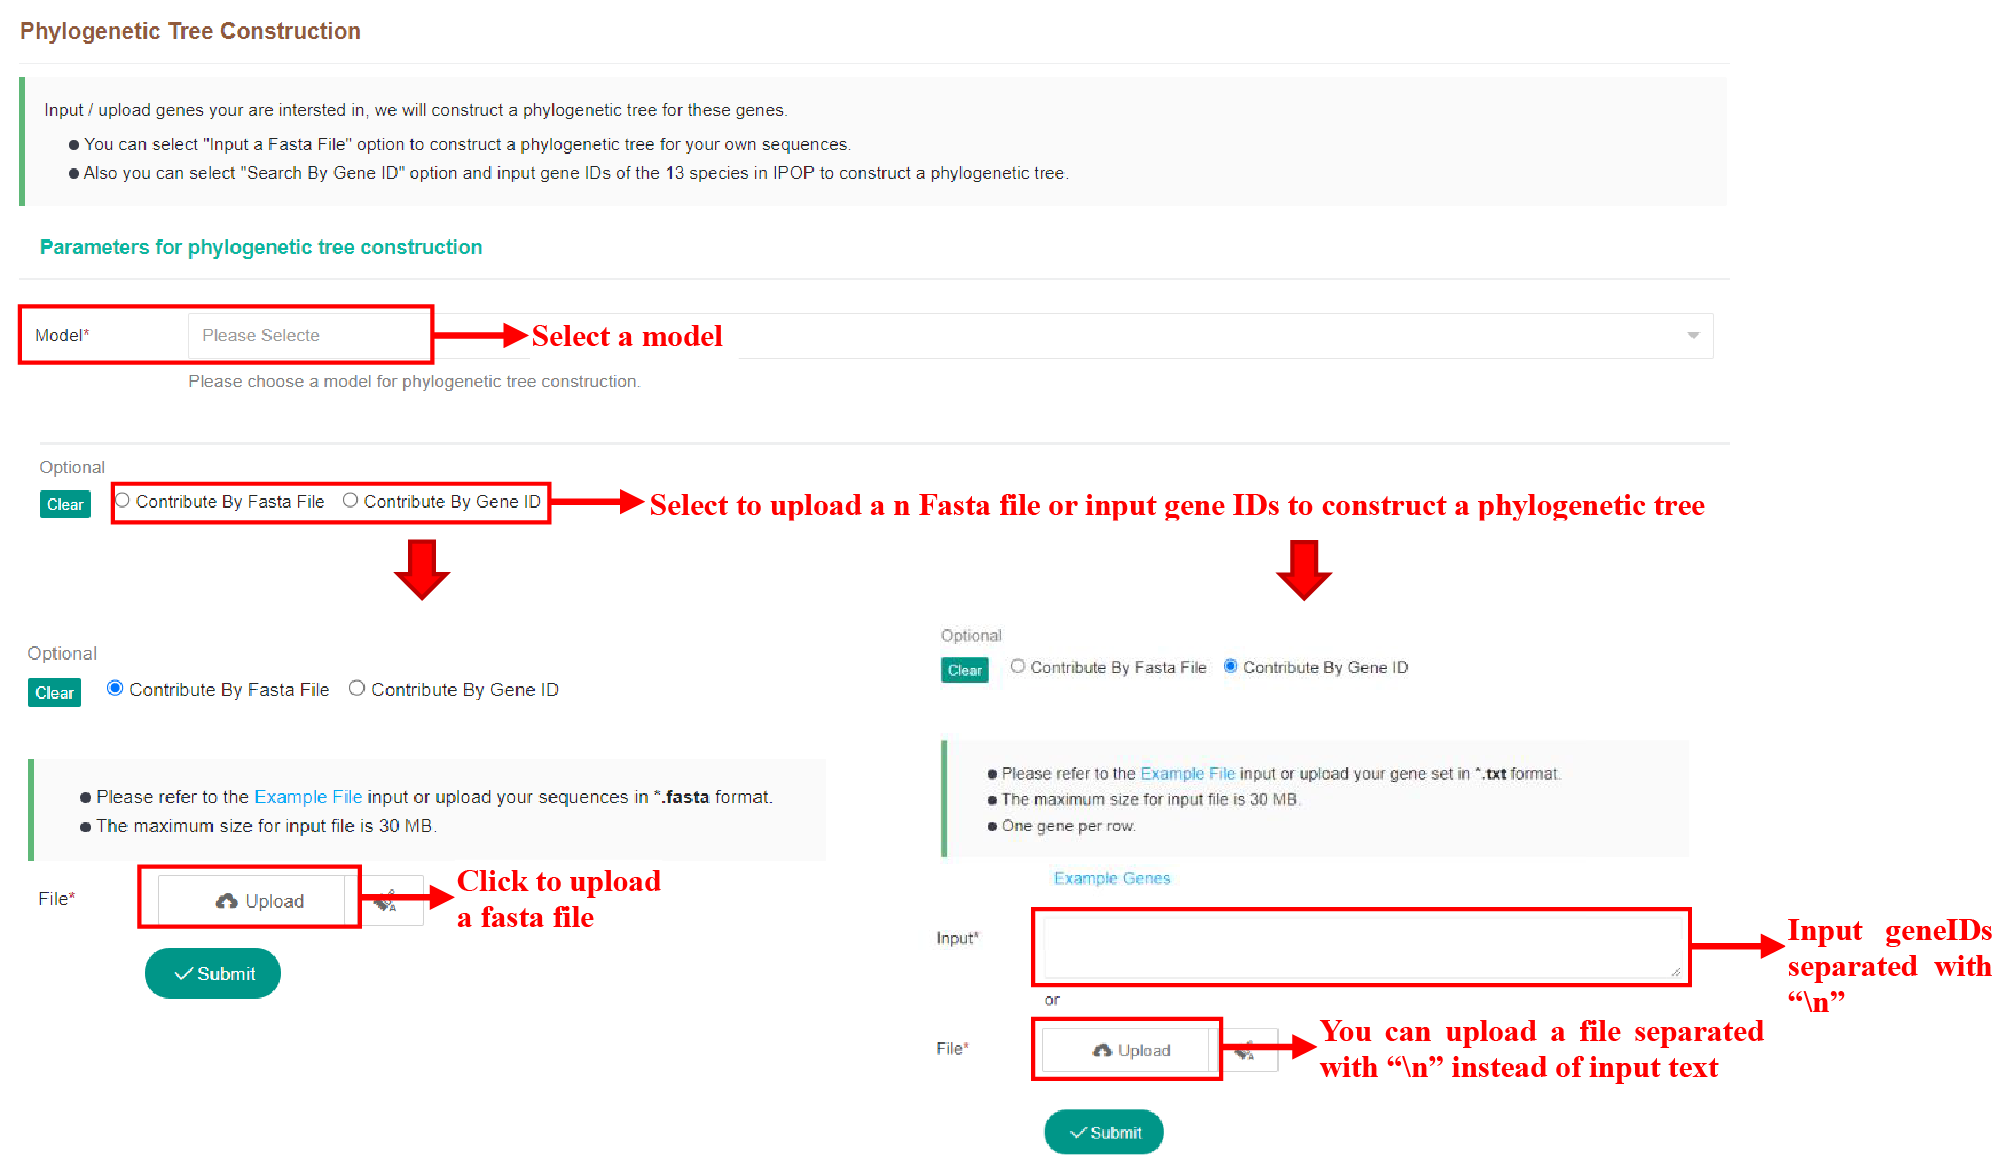
Figure 54 Submission of Phylogenetic Tree Construction tool
The Phylogenetic Tree Construction tool can be used to build an evolutionary tree using either a Fasta file or gene IDs that matches the genome version in the database.
5.5.2 Result Page
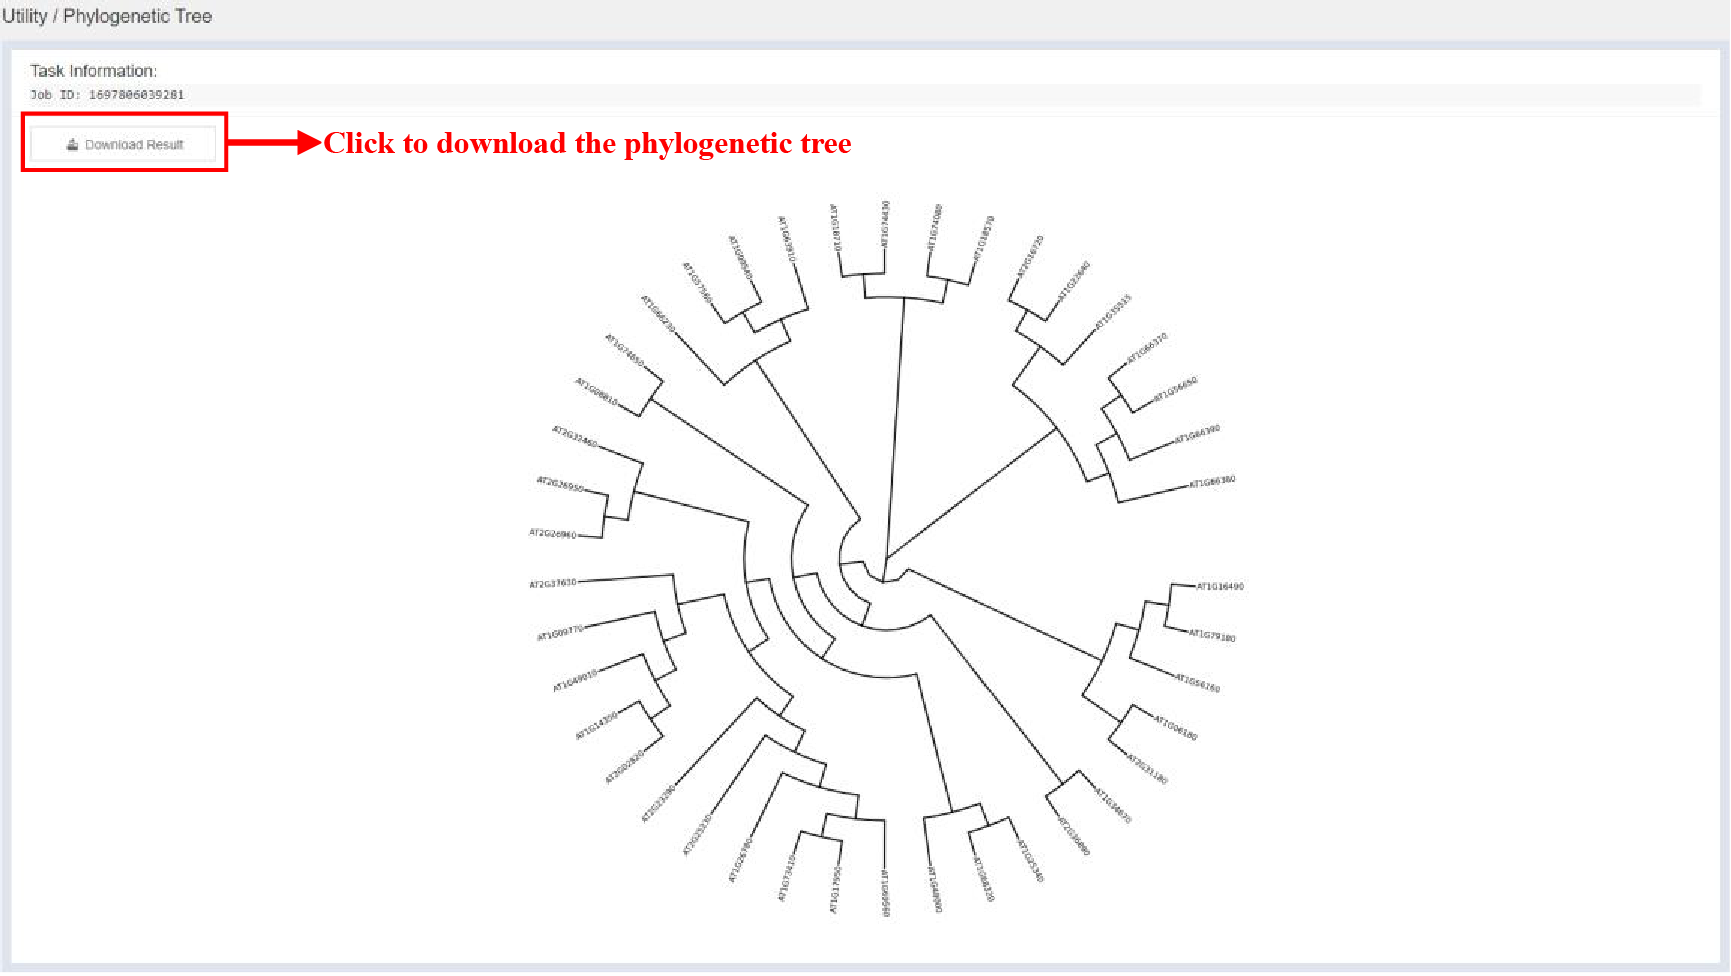
Figure 55 Result of Phylogenetic Tree Construction tool
5.6 Basic Local Alignment Search Utility
5.6.1 Submit Tasks
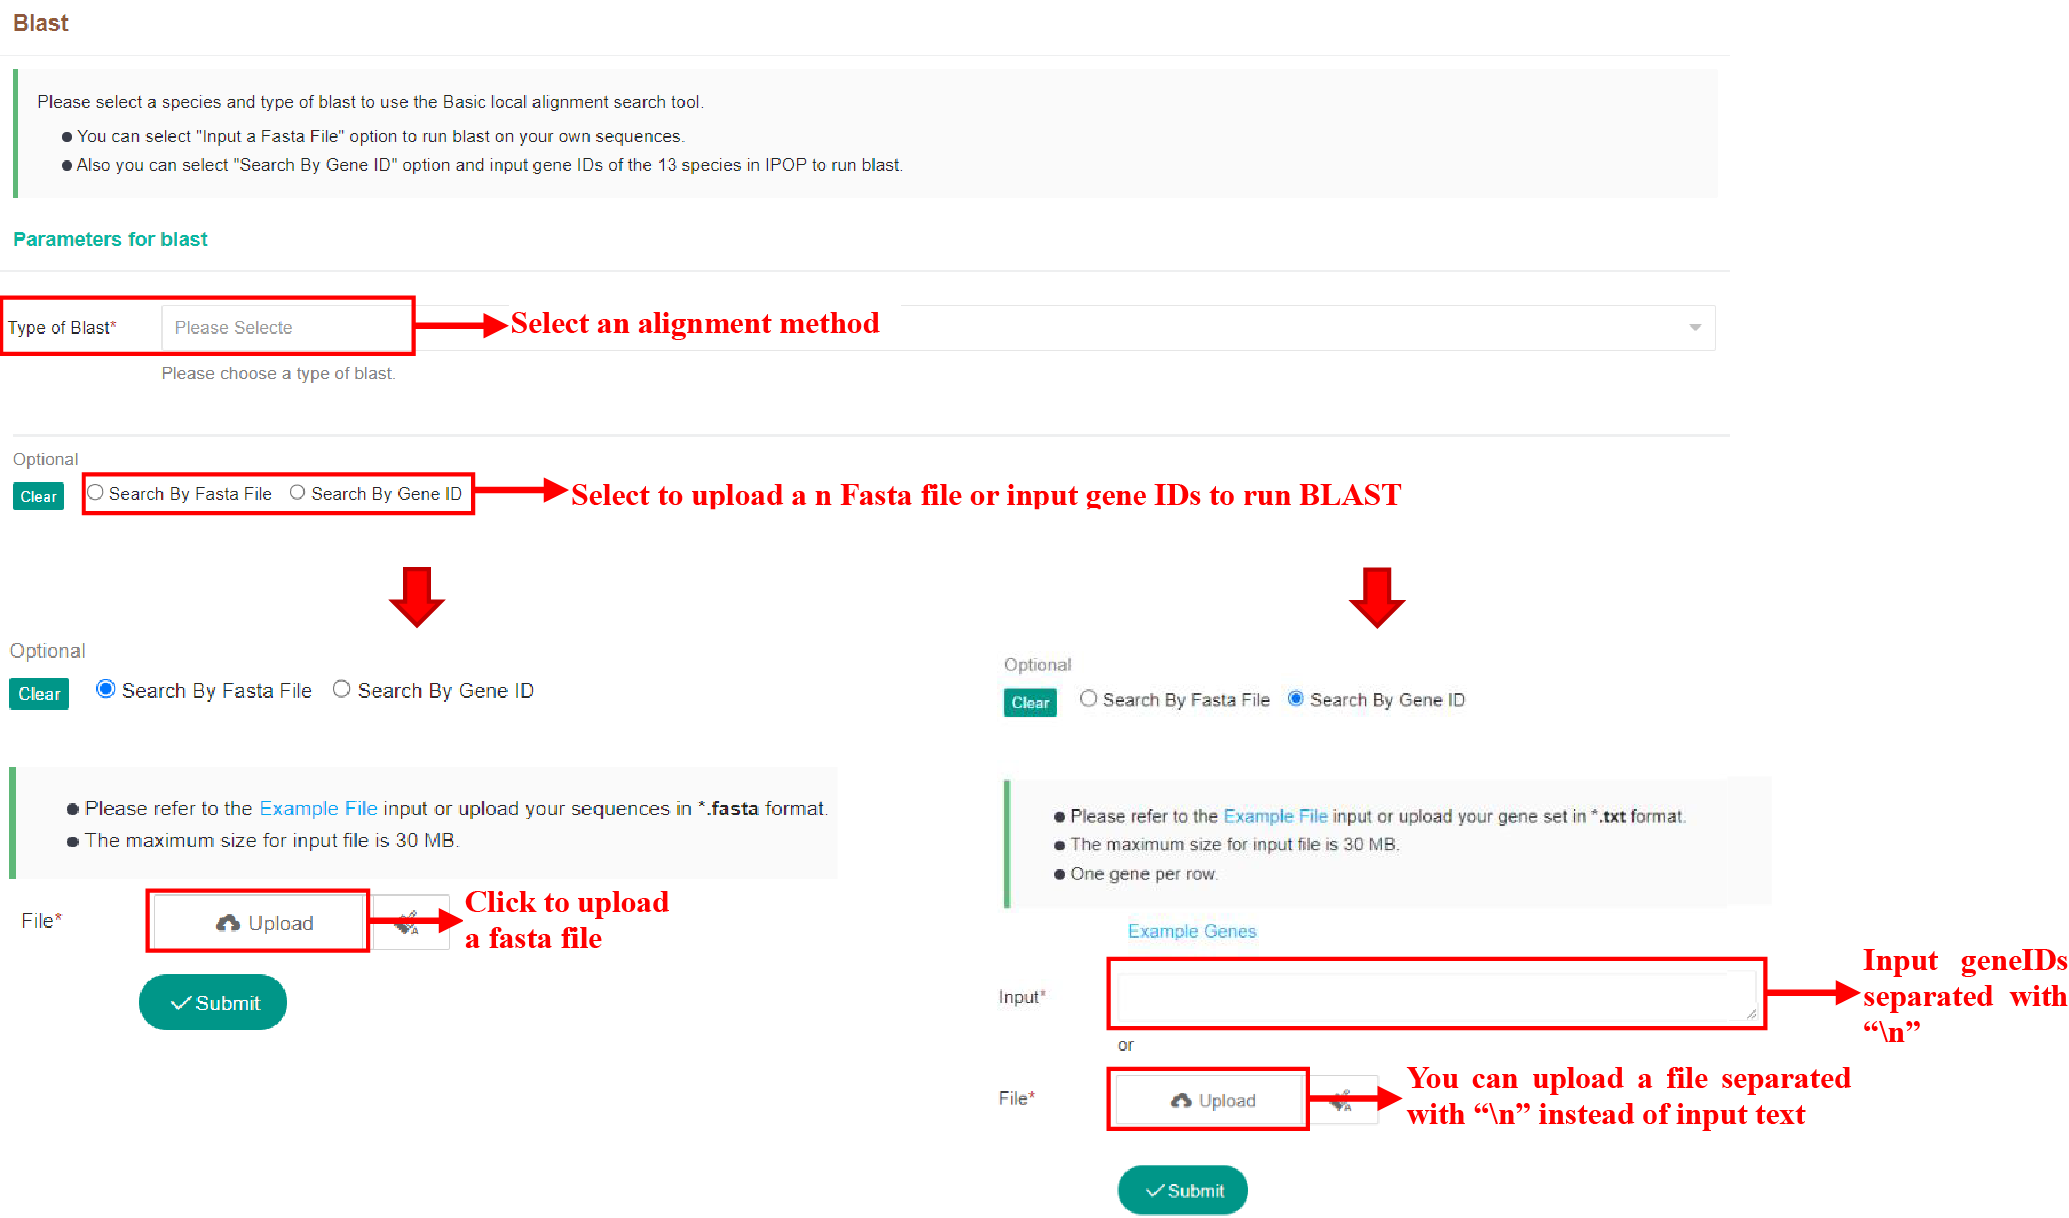
Figure 56 Submission of Basic Local Alignment Search tool
5.6.2 Result Page
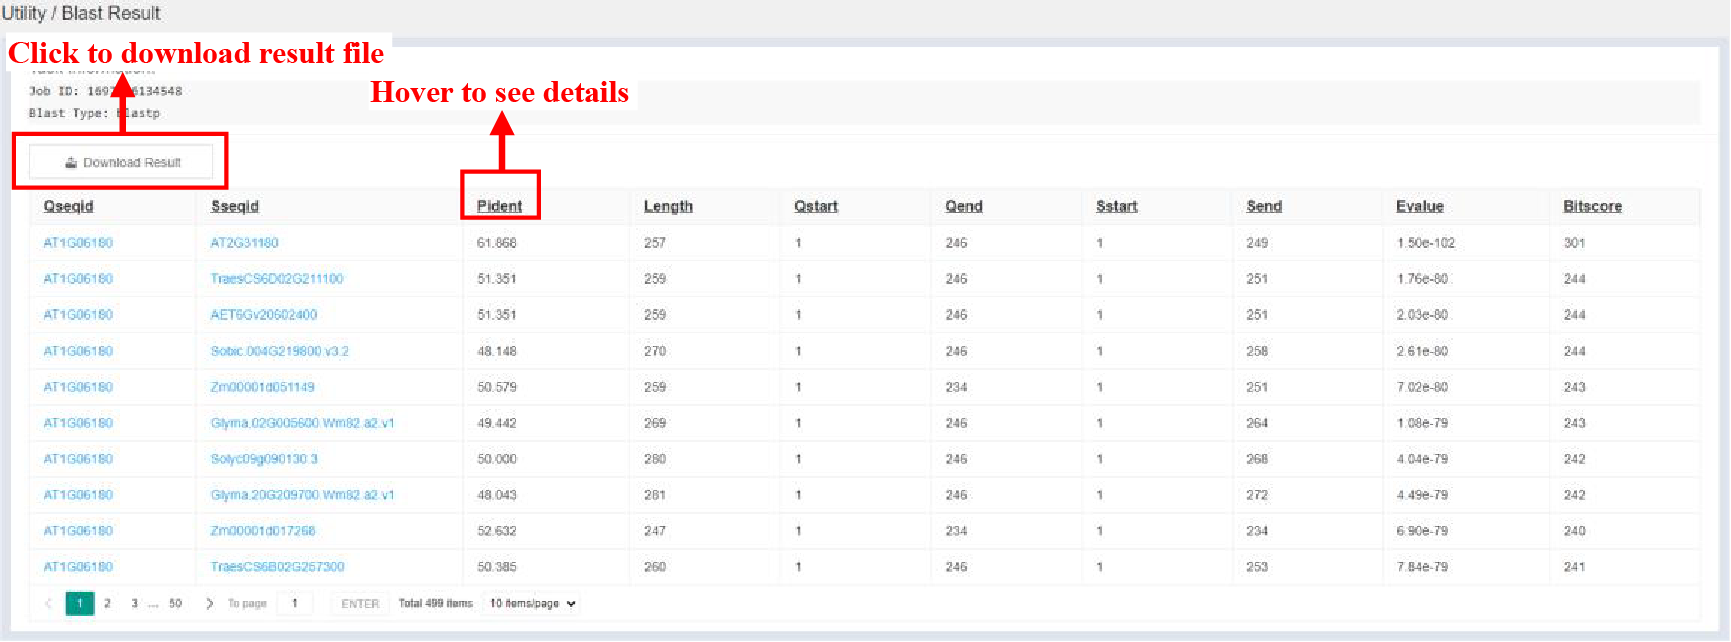
Figure 57 Result of Basic Local Alignment Search tool
BLAST results are displayed in the form of a table, and the contents of the table are as follows:
| Columns | Details |
|---|---|
| Qseqid | Query sequence ID |
| Sseqid | Subject sequence ID |
| Pident | Percentage of identical matches |
| Length | Alignment length |
| Qstart | Start of alignment in query |
| Qend | End of alignment in query |
| Sstart | Start of alignment in subject |
| Send | End of alignment in subjuct |
| Evalue | Expect value |
| Bitscore | Bit score |
6 Download
The Download bar on the home page provides downloads of all the result data in the database.
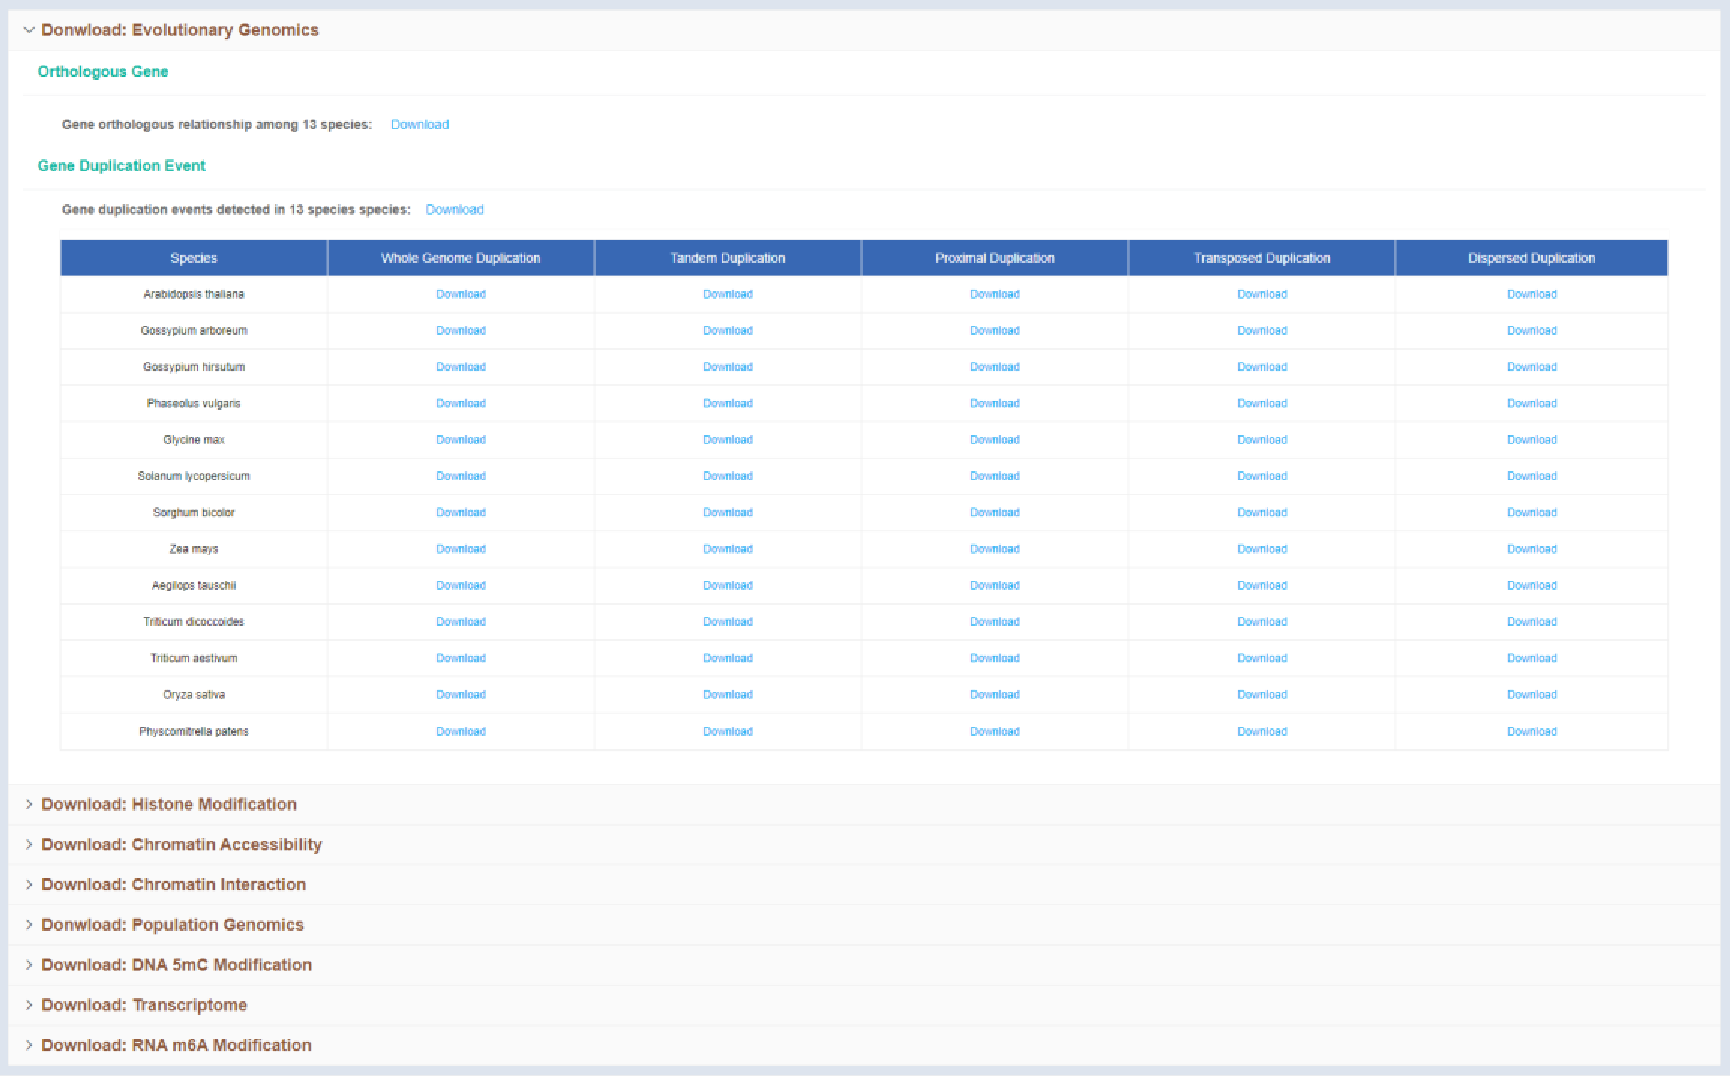
Figure 58 Download module
7 Related software used in study
| Software | Reference | Resource |
|---|---|---|
| BLAST | https://bmcbioinformatics.biomedcentral.com/articles/10.1186/1471-2105-10-421 | https://blast.ncbi.nlm.nih.gov/Blast.cgi |
| FastTree | https://academic.oup.com/mbe/article/26/7/1641/1128976 | https://github.com/PavelTorgashov/FastTree |
| DESeq2 | https://genomebiology.biomedcentral.com/articles/10.1186/s13059-014-0550-8 | https://github.com/thelovelab/DESeq2 |
| CGmapTools | https://doi.org/10.1093/bioinformatics/btx595 | https://github.com/guoweilong/cgmaptools |
| BEDTools | https://doi.org/10.1093/bioinformatics/btq033 | https://github.com/arq5x/bedtools2 |
| FUSION | https://www.nature.com/articles/ng.3506 | http://gusevlab.org/projects/fusion/ |
| Fastp | https://doi.org/10.1093/bioinformatics/bty560 | https://github.com/OpenGene/fastp |
| MultiQC | https://doi.org/10.1093/bioinformatics/btw354 | https://multiqc.info/ |
| BWA-MEM | https://arxiv.org/abs/1303.3997 | https://github.com/lh3/bwa |
| SAMtools | https://doi.org/10.1093/gigascience/giab008 | https://github.com/samtools/samtools |
| Picard | / | https://broadinstitute.github.io/picard/ |
| MACS2 | https://genomebiology.biomedcentral.com/articles/10.1186/gb-2008-9-9-r137 | https://github.com/macs3-project/MACS |
| DeepTools | https://doi.org/10.1093/nar/gkw257 | https://github.com/deeptools/deepTools |
| ChIPseeker | https://doi.org/10.1093/bioinformatics/btv145 | https://bioconductor.org/packages/release/bioc/html/ChIPseeker.html |
| DiffBind | https://www.nature.com/articles/nature10730 | https://github.com/aeron15/DiffBind |
| HIC-Pro | https://genomebiology.biomedcentral.com/articles/10.1186/s13059-015-0831-x | http://github.com/nservant/HiC-Pro |
| Juicer | https://doi.org/10.1016/j.cels.2016.07.002 | https://github.com/aidenlab/Juicebox/wiki/Download |
| Bismark | https://doi.org/10.1093/bioinformatics/btr167 | https://github.com/FelixKrueger/Bismark |
| CGmapTools | https://doi.org/10.1093/bioinformatics/btx595 | https://cgmaptools.github.io/ |
| MethGo | https://bmcgenomics.biomedcentral.com/articles/10.1186/1471-2164-16-S12-S11 | http://paoyangchen-laboratory.github.io/methgo/ |
| HISAT2 | https://www.nature.com/articles/nmeth.3317 | https://daehwankimlab.github.io/hisat2/download/ |
| StringTie | https://www.nature.com/articles/nprot.2016.095 | https://ccb.jhu.edu/software/stringtie/ |
| featureCounts | https://doi.org/10.1093/bioinformatics/btt656 | https://sourceforge.net/projects/subread/files/subread-2.0.6/ |
| PEA | https://doi.org/10.1093/bioinformatics/bty421 | https://github.com/cma2015/PEA |
| IRanges | https://doi.org/10.1371/journal.pcbi.1003118 | https://bioconductor.org/packages/release/bioc/html/IRanges.html |
| VCFtools | https://doi.org/10.1093/bioinformatics/btr330 | https://vcftools.sourceforge.net/downloads.html |
| Trimmomatic | https://doi.org/10.1093/bioinformatics/btu170 | https://github.com/usadellab/Trimmomatic |
| STAR | https://www.nature.com/articles/ng.3506 | https://doi.org/10.1093/bioinformatics/bts635 |
| OrthoFinder | https://genomebiology.biomedcentral.com/articles/10.1186/s13059-019-1832-y | https://github.com/davidemms/OrthoFinder |
| DIAMOND | https://www.nature.com/articles/nmeth.3176 | http://ab.inf.uni-tuebingen.de/software/diamond |
| TimeTree | https://doi.org/10.1093/molbev/msx116 | http://www.timetree.org |
| DupGen_finder | https://genomebiology.biomedcentral.com/articles/10.1186/s13059-019-1650-2 | https://github.com/qiao-xin/DupGen_finder |